This month’s new platform updates improve Enterprise workspaces and make data wrangling easier. Read about these releases below and keep tabs on new features as they happen with our release notes.
Store files in your own S3 bucket
Using private cloud storage for file attachments allows you to comply with internal security protocol and best practices when creating data visualizations with company or customer data. Now, if you have an Enterprise tier workspace, you can use a private S3 bucket to store file attachment data in Observable.
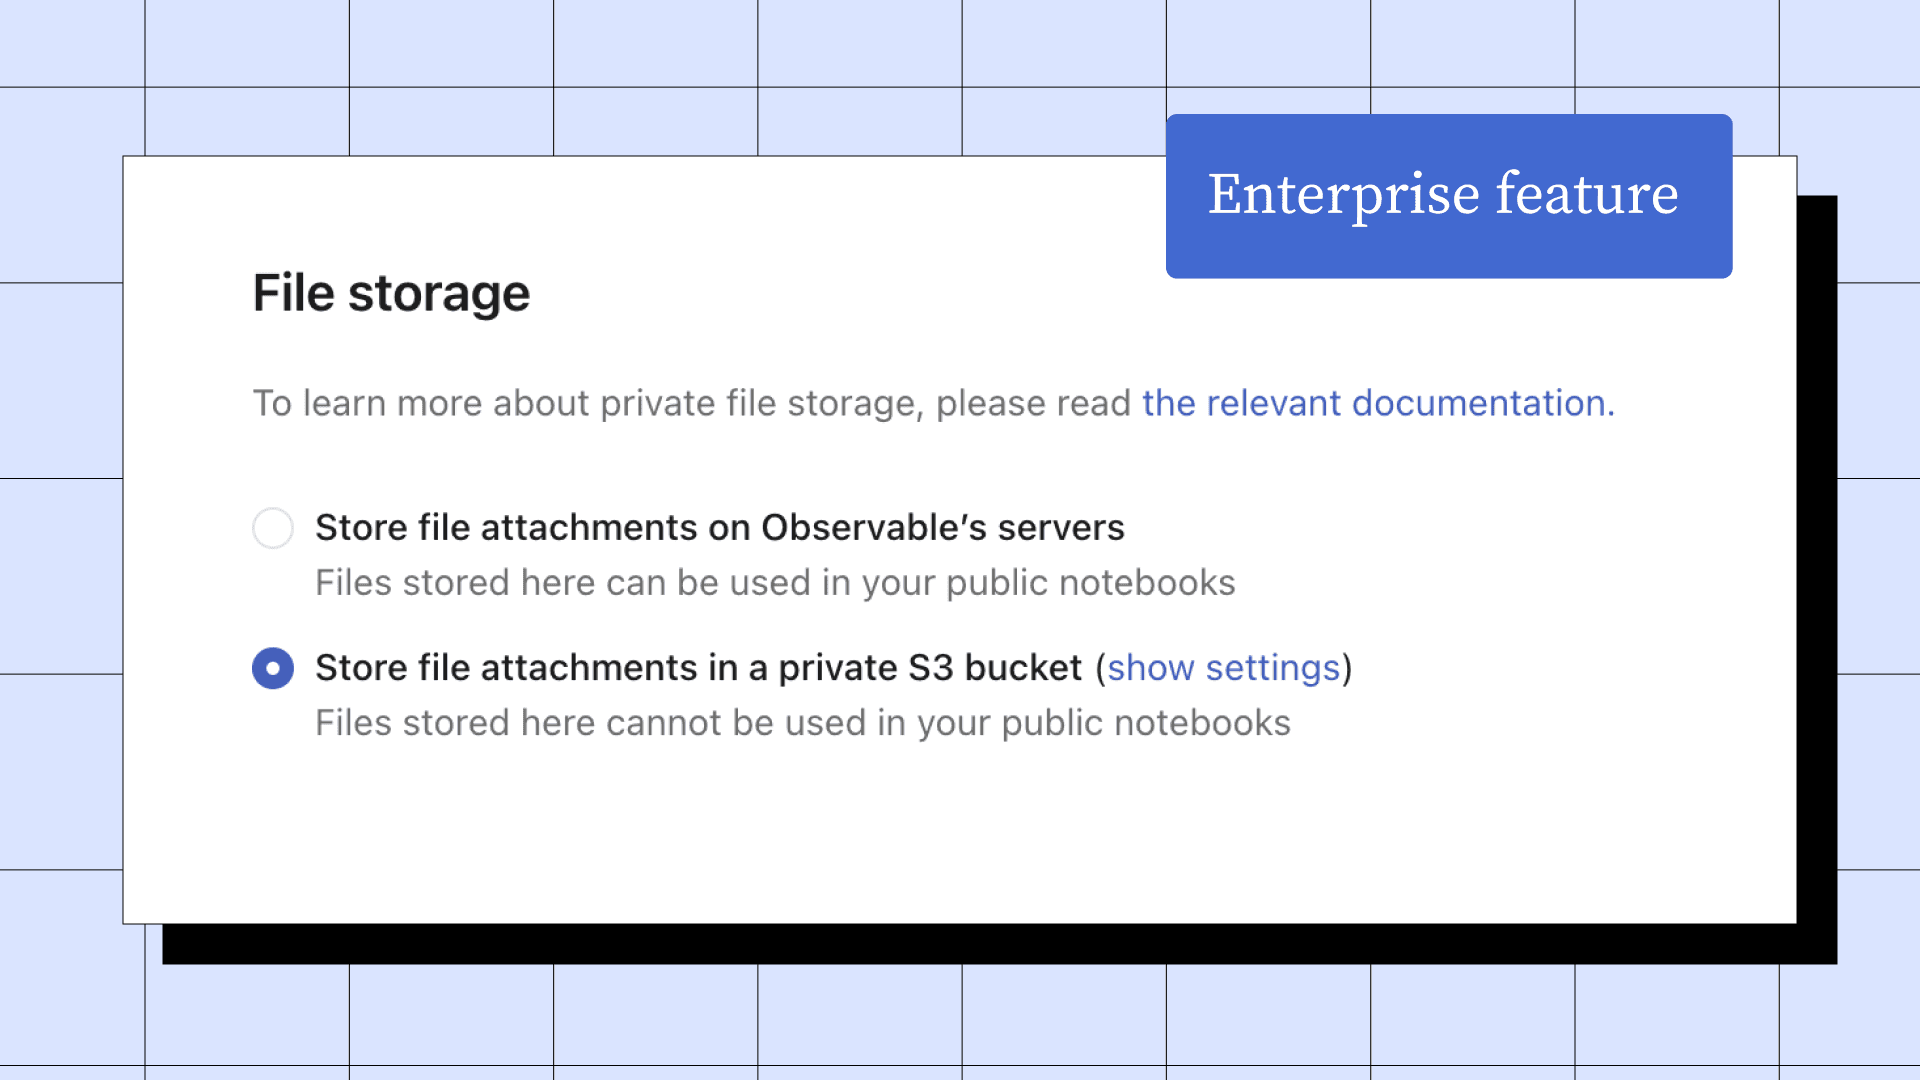
Head to our docs to learn more about private file storage.
Convert Chart cell to Observable Plot code
One of the benefits of Observable is that you can choose between no- and low-code charts, depending on your data work at hand. Now, in the Chart cell, you can convert your chart into Observable Plot code. This means that you can quickly build a baseline chart in Chart cell and then convert it to code for unlimited customization.
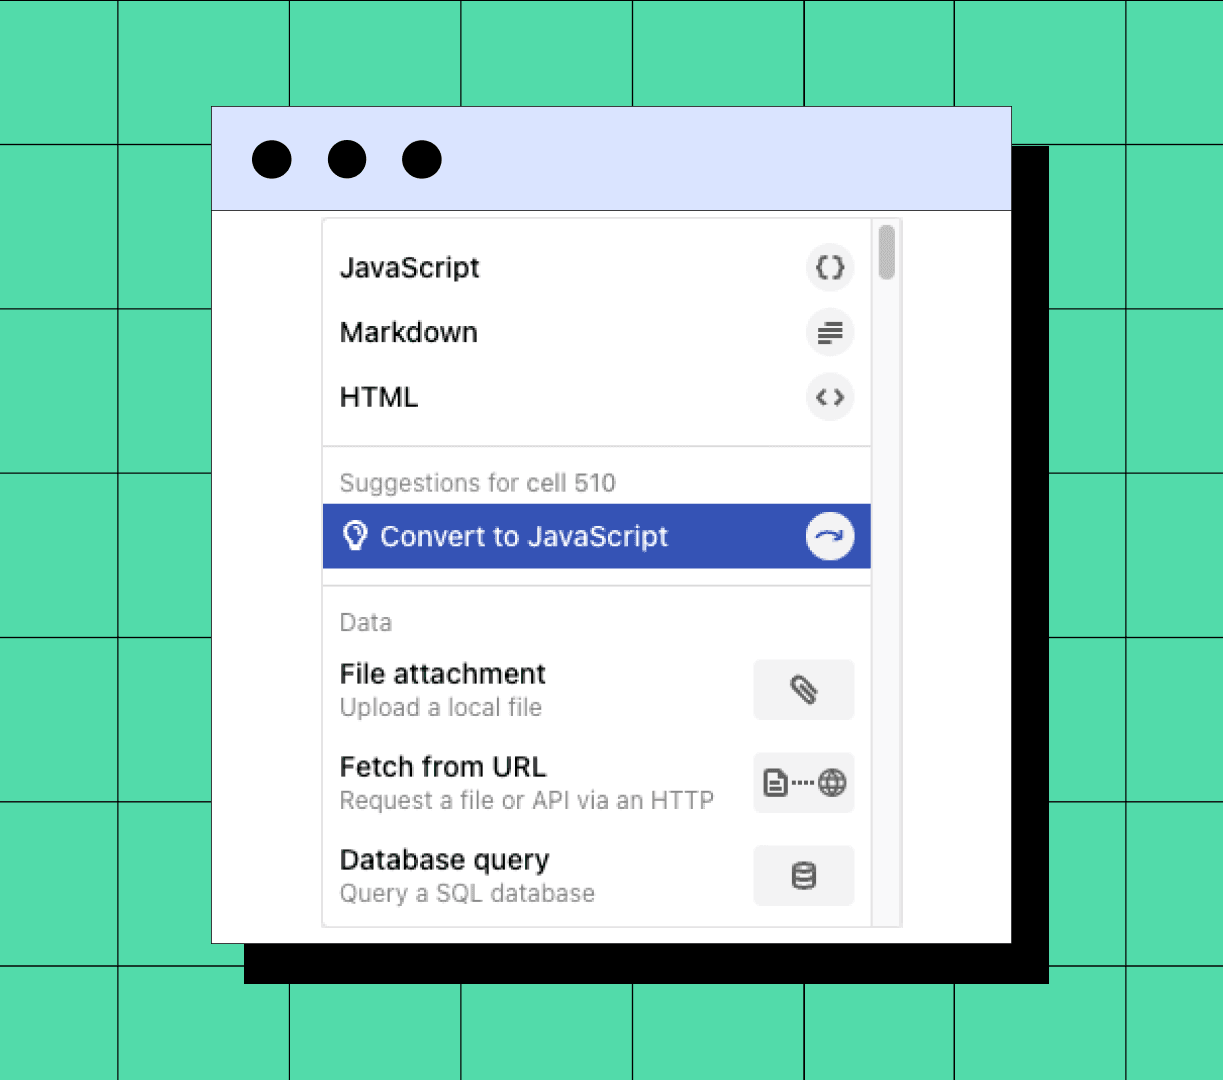
If you’re looking to up-level your Observable Plot skills, this is also a great way to interactively learn the Observable Plot API. You can learn more about Observable Plot in the docs.
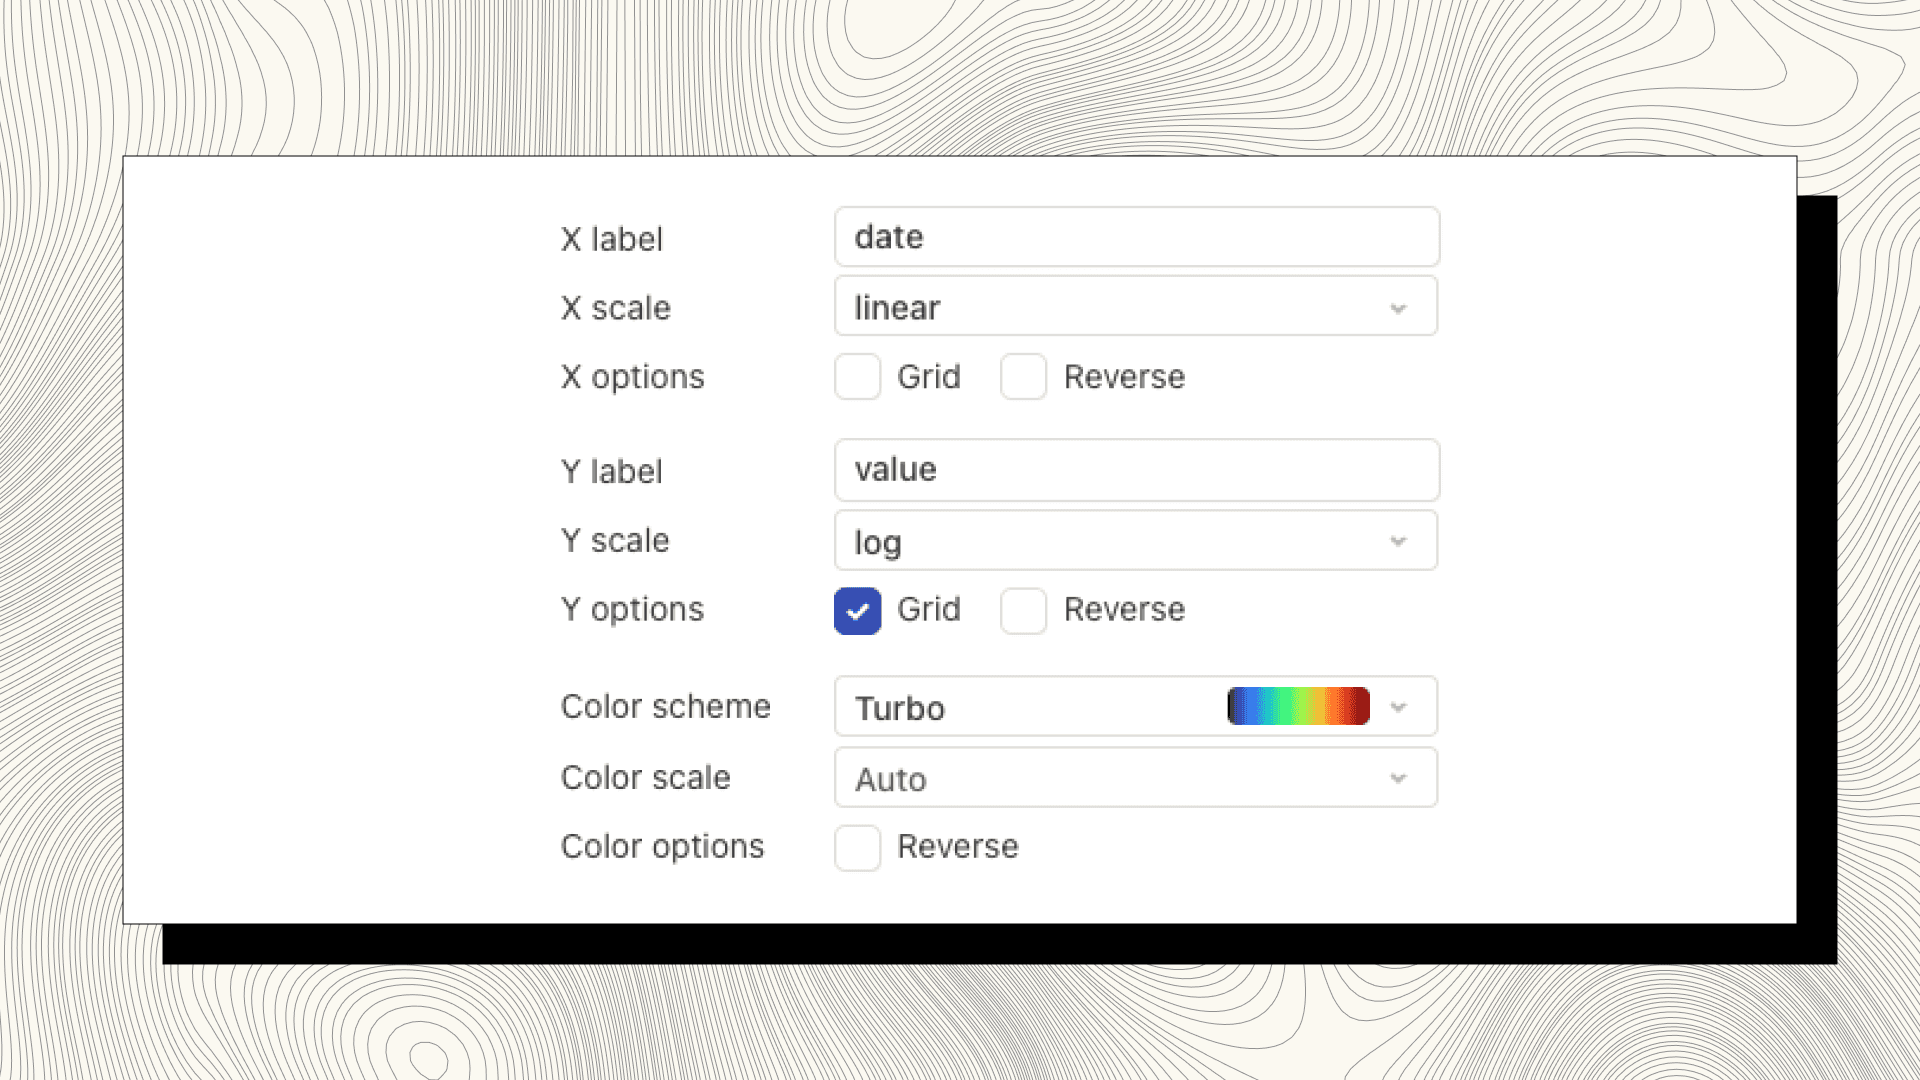
Unlock insights in Chart cell
Gain new insights in a fraction of the time with our recent Chart cell updates. Previously, non-linear positional and color scales were only available in Observable Plot, but they are now available in Chart cell.
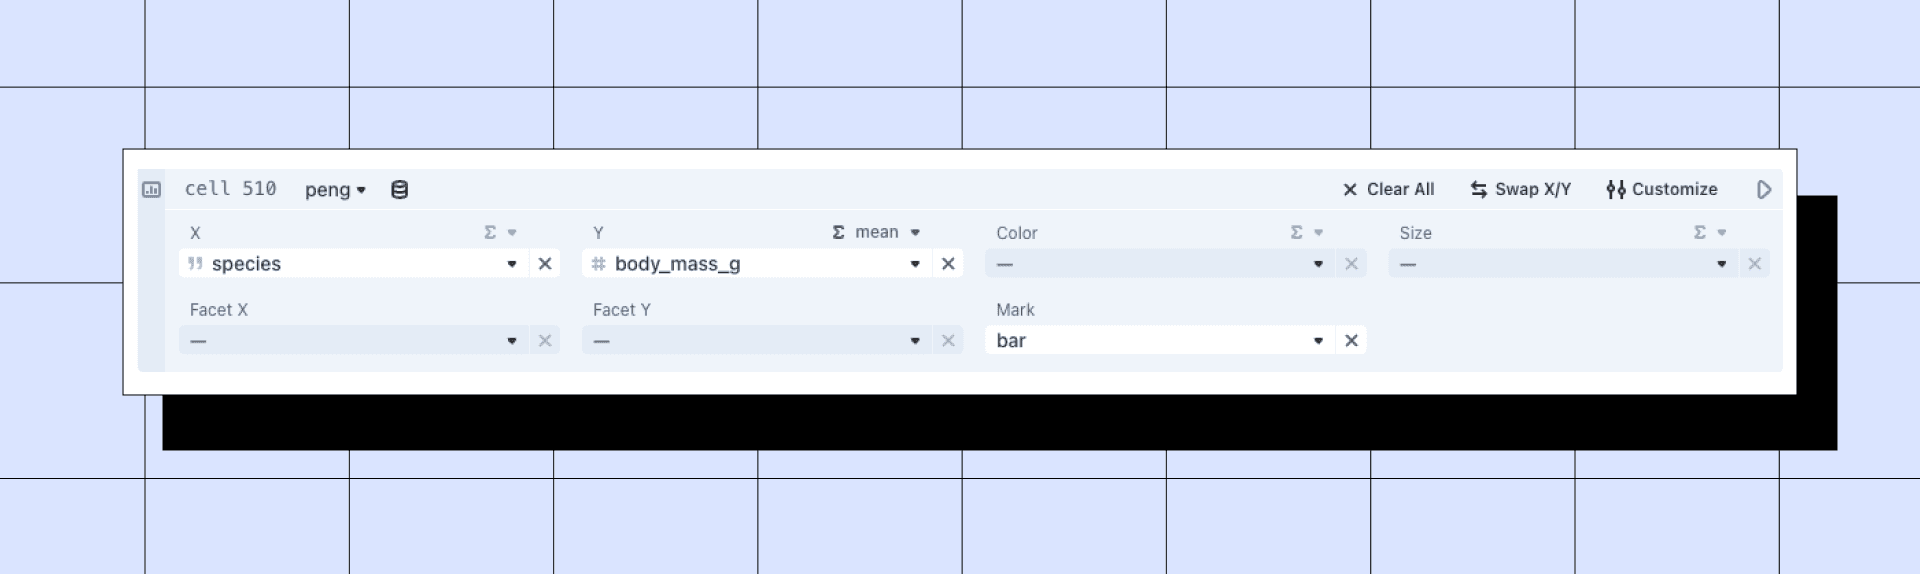
The Chart cell user interface has also been refreshed to emphasize the most commonly used fields. Reducers can be helpful for building certain charts, but since they are infrequently used we moved them into the 𝚺 menus that are available above each field. We also made it easier to identify the fields you've overridden. Pro tip: you can also quickly navigate the fields using the Tab key and cycle through values using the arrow keys.
Conclusion
We want to hear what you think about these new releases. Share your feedback or any additional feature ideas on the feedback repo.