Querying databases with SQL is incredibly powerful, but SQL is not an easy language to use for anybody. Another approach is to use a graphical user interface that lets you ask many of the same questions, but without the need to know a query language. Observable Canvases are one such interface.
Canvases are our new way of creating visualizations and data workflows. Through the use of interactive tables for data, nodes for different operations, and connections between them, they allow users to ask questions much faster and more easily than using SQL. You can still use SQL, as you will see below. But many of the common questions you might ask about data can be answered with a few clicks on a canvas.
In this post, we look at how canvases let you quickly answer many common database questions, just in a faster and more visual way than using SQL.
This is the view of the orders table from our fictional pizza chain on a canvas. It shows the columns for order ID, customer ID, number of items, order date, store ID, and the total amount for the order.
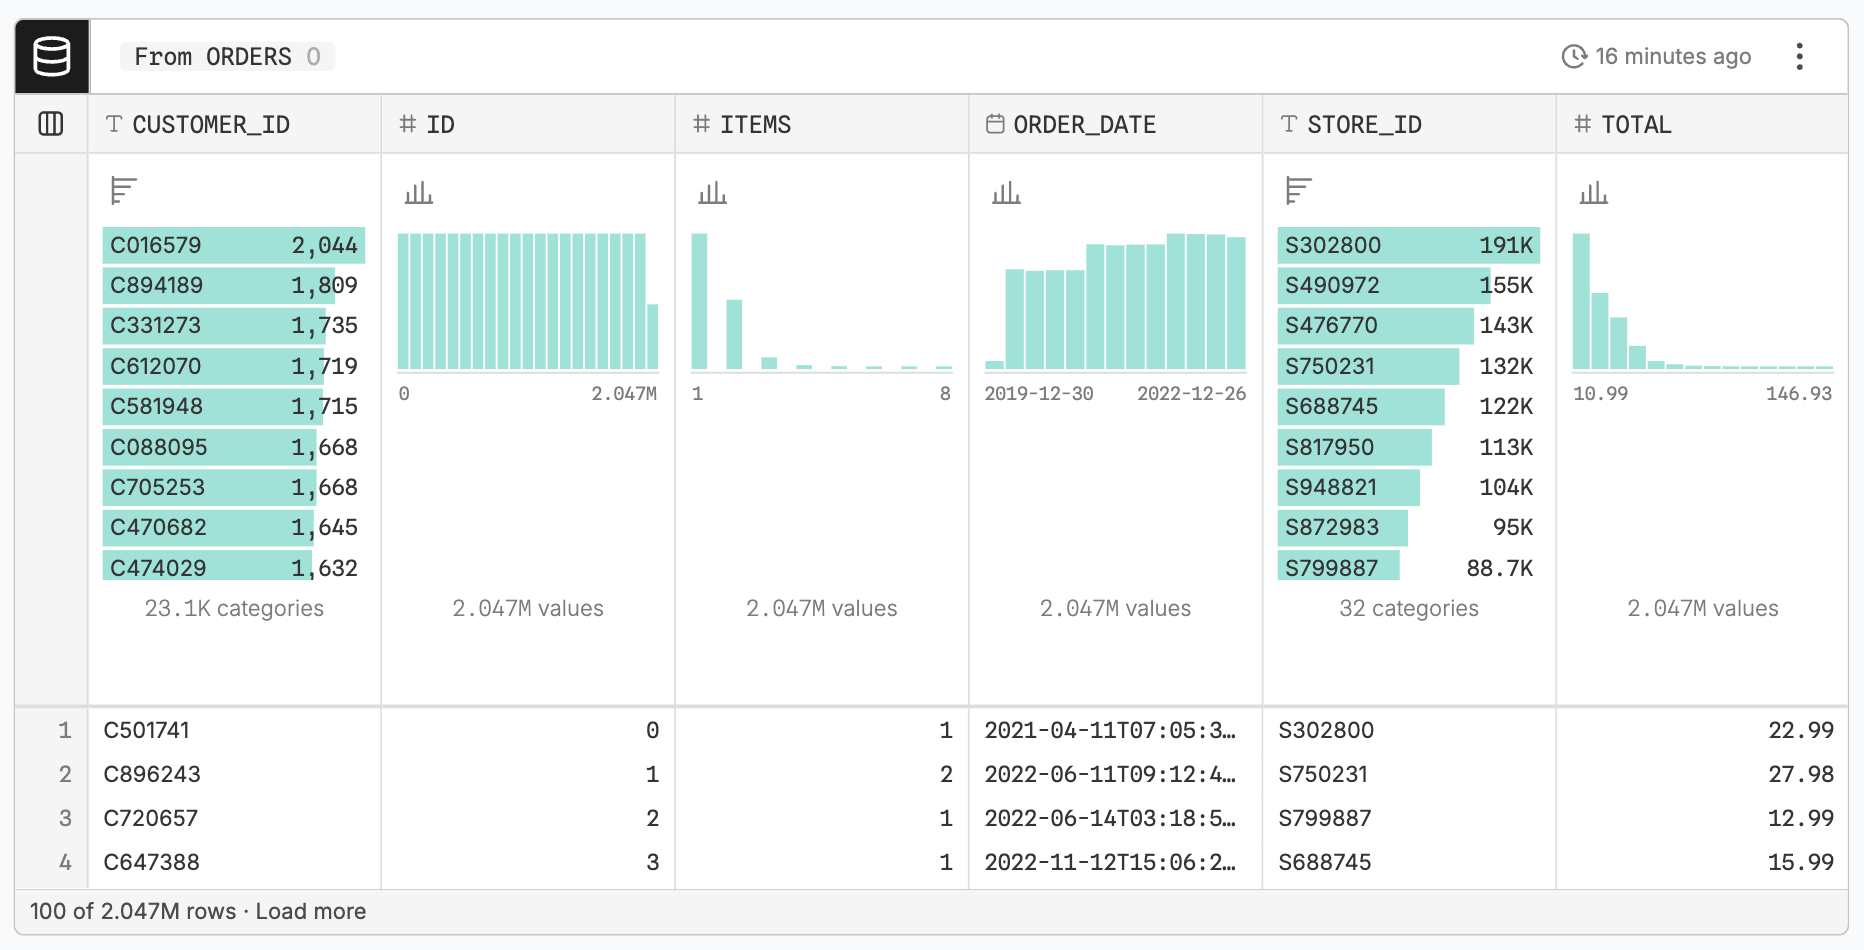
The first thing we want to do, as in our previous post on the basics of SQL, is to count the number of rows. In SQL, you do that by writing this query:
SELECT COUNT(*) AS numOrders
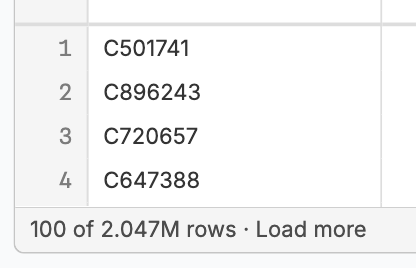
FROM pizzaOrdersIn a table node, we don’t even need to do anything to get that information. The table tells us the number of rows right there, in the lower left.
We can also count how many different values there are in a column, for example to determine the number of stores. Every store ID shows up many times in our orders dataset, but by asking for only distinct values, we only get each of them once.
In SQL, this is done using the DISTINCT keyword, like in this query:
SELECT COUNT(DISTINCT storeId) AS numStores
  FROM orders
Observable Canvases have a specific node for this, which I can attach to the table to perform this operation for me.
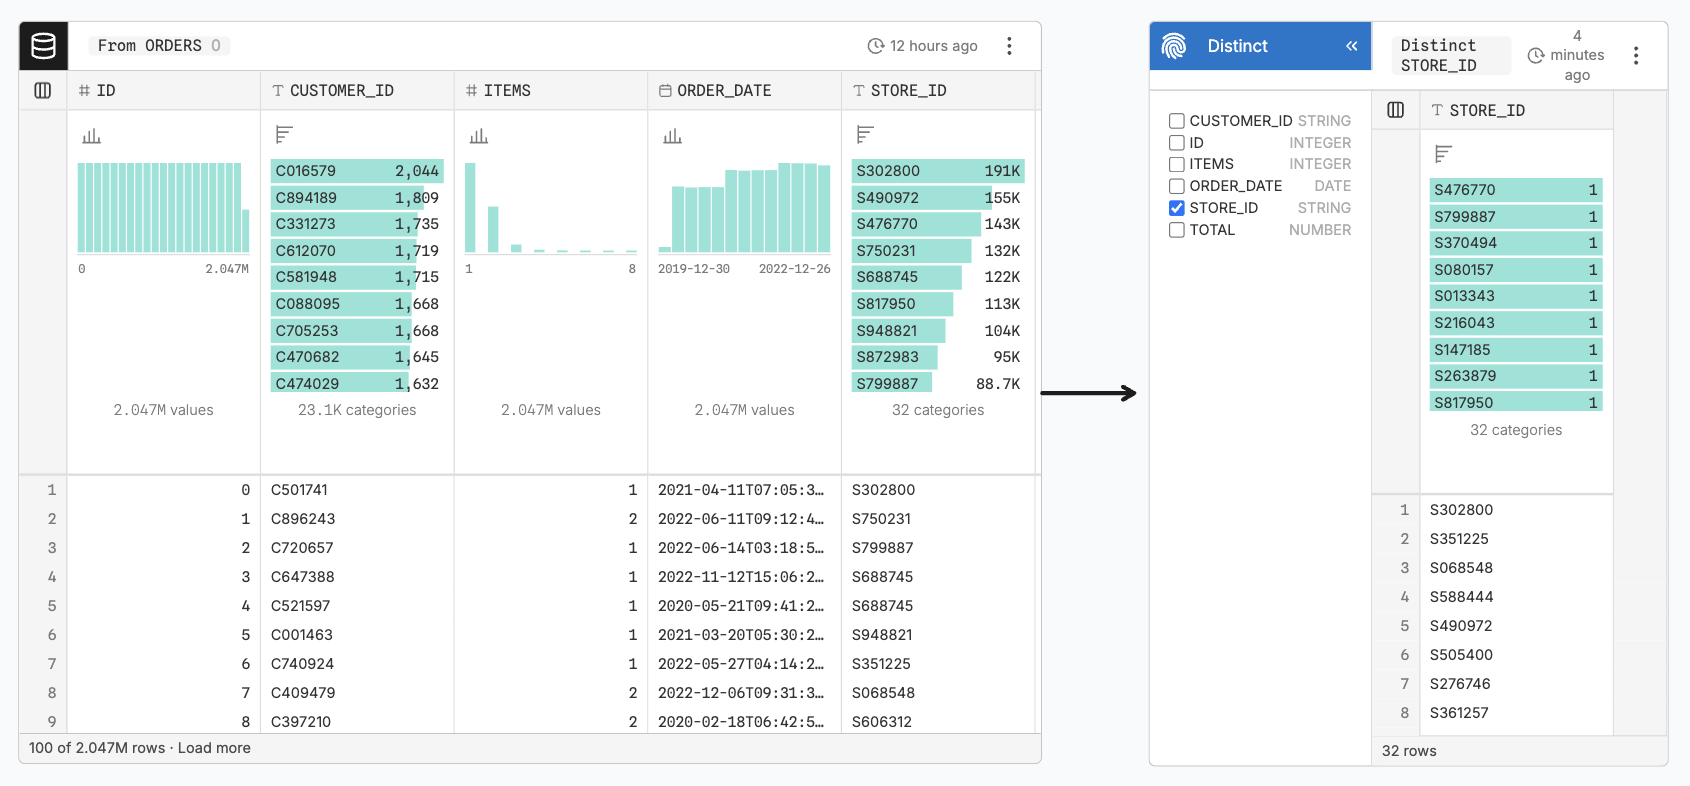
It doesn’t just count the distinct values, but returns a list of all of them. The count is shown on the bottom, but I can also use this table for further analyses by connecting it to other nodes.
To aggregate values, for example to count the number of rows, or to sum up the totals, we use a GROUP BY clause in SQL. It gets added to the end of the query that counts records we already used above, and it looks like this:
SELECT storeId, COUNT(*) AS numOrders
  FROM orders
  GROUP BY storeId
Group nodes on canvases provide the same function. They can count, but also compute the sum, average, etc. We can then pick the categorical dimension to group by from a list, in our case the store ID.
We can also sort by the total amount by clicking the little sort icon in its column. In SQL, this would require another addition to our query, ORDER BY:
SELECT storeId, COUNT(*) AS numOrders
  FROM orders
  GROUP BY storeId
ORDER BY numOrders DESCThere is a lot more useful functionality in these tables, like the small overview charts at the top. In addition to showing us the distribution of values, they also allow us to quickly filter the data.
Let’s say we want to filter to only orders over $100. In SQL, this requires a WHERE clause that looks like this:
SELECT *
  FROM orders
  WHERE total > 100
There are two different ways to do this on canvases, one by using a Where node (which we’ll get to below), and the other by simply dragging the mouse over the histogram in the TOTAL (right-most) column.
This also works for any of the categorical dimensions by clicking on the bar representing a particular store, for example.
We can also invert the filter to exclude values by holding down the option/alt key while clicking a category. For example, if we wanted to exclude specific customers, we could alt-click them to remove their records from the table.
If we want to make the filtering more visible, and also more permanent as a part of our analysis flow, we can use a Where node. This works just like the Group node above, except can now enter a condition just like the WHERE clause of a SQL statement.

This gives us the same result as filtering on the histogram, but is more visible.
Nodes can be chained to build more complex queries in steps. For example, we can attach a Group node to the Where node we just created. It will count the orders by store, but only the ones with a value over $100. They are again sorted by value in descending order.
In SQL, this would look like this:
SELECT storeId, COUNT(*) AS numOrders
  FROM orders
  WHERE total > 100
  GROUP BY storeId
  ORDER BY numOrders DESC
You don’t have to use separate nodes, though. The data flowing through connected nodes updates when you use a histogram to filter a table. So instead of using the Where node, I can also just brush inside the table, and the connected Group node from earlier will give me the same result.
Using separate nodes here has the advantage of preserving specific analysis steps, and letting you build branching analyses to test out different ideas and answer different questions. For quick exploration, filtering inside a table is probably the better way to go.
Since all of these table operations and nodes get translated into SQL anyway, it is of course possible to simply write SQL in Observable Canvases as well. You do that using a SQL node.
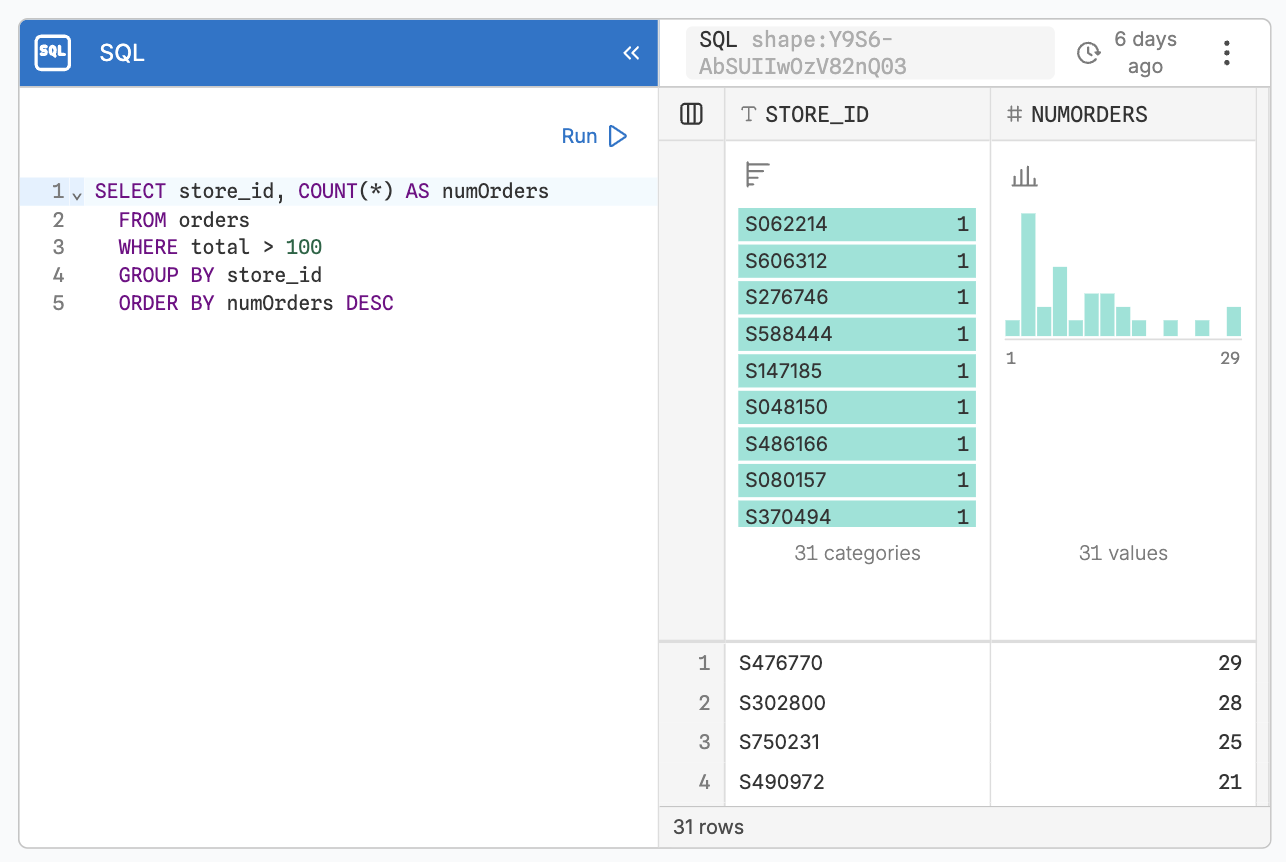
This is the same query we looked at above and in the previous post. This gives you all the power to use SQL queries of any complexity, and lets you use all the queries we covered in our previous post.
Separate nodes make it easier to interact with your analysis, and it will be easier to understand for people not familiar with SQL. But on the other hand, a SQL query can let you accomplish several steps at once, and might help hide some of the complexity of an analysis as well.
Observable Canvases make it possible to create queries without the need to know SQL. They also make them much more interactive, by allowing users to move selections easily, instead of having to edit SQL expressions. Chaining nodes also allows users to build queries in parts and make them easier to understand at the same time.
Learn more about Observable Canvases here and request a demo!