In July 2024, as U.S. election news took a dramatic turn, one Observable Notebook surged in popularity: the ActBlue Ticker Tracker.
Created by Ryan Murphy, this dashboard accesses and visualizes contributions to ActBlue for “democratic candidates and progressive causes,” as reported by the ActBlue website. The tracker saw a massive spike in traffic, topping Observable‘s charts with over 950,000 views after Joe Biden’s withdrawal from the 2024 Presidential race and Kamala Harris’s subsequent nomination.
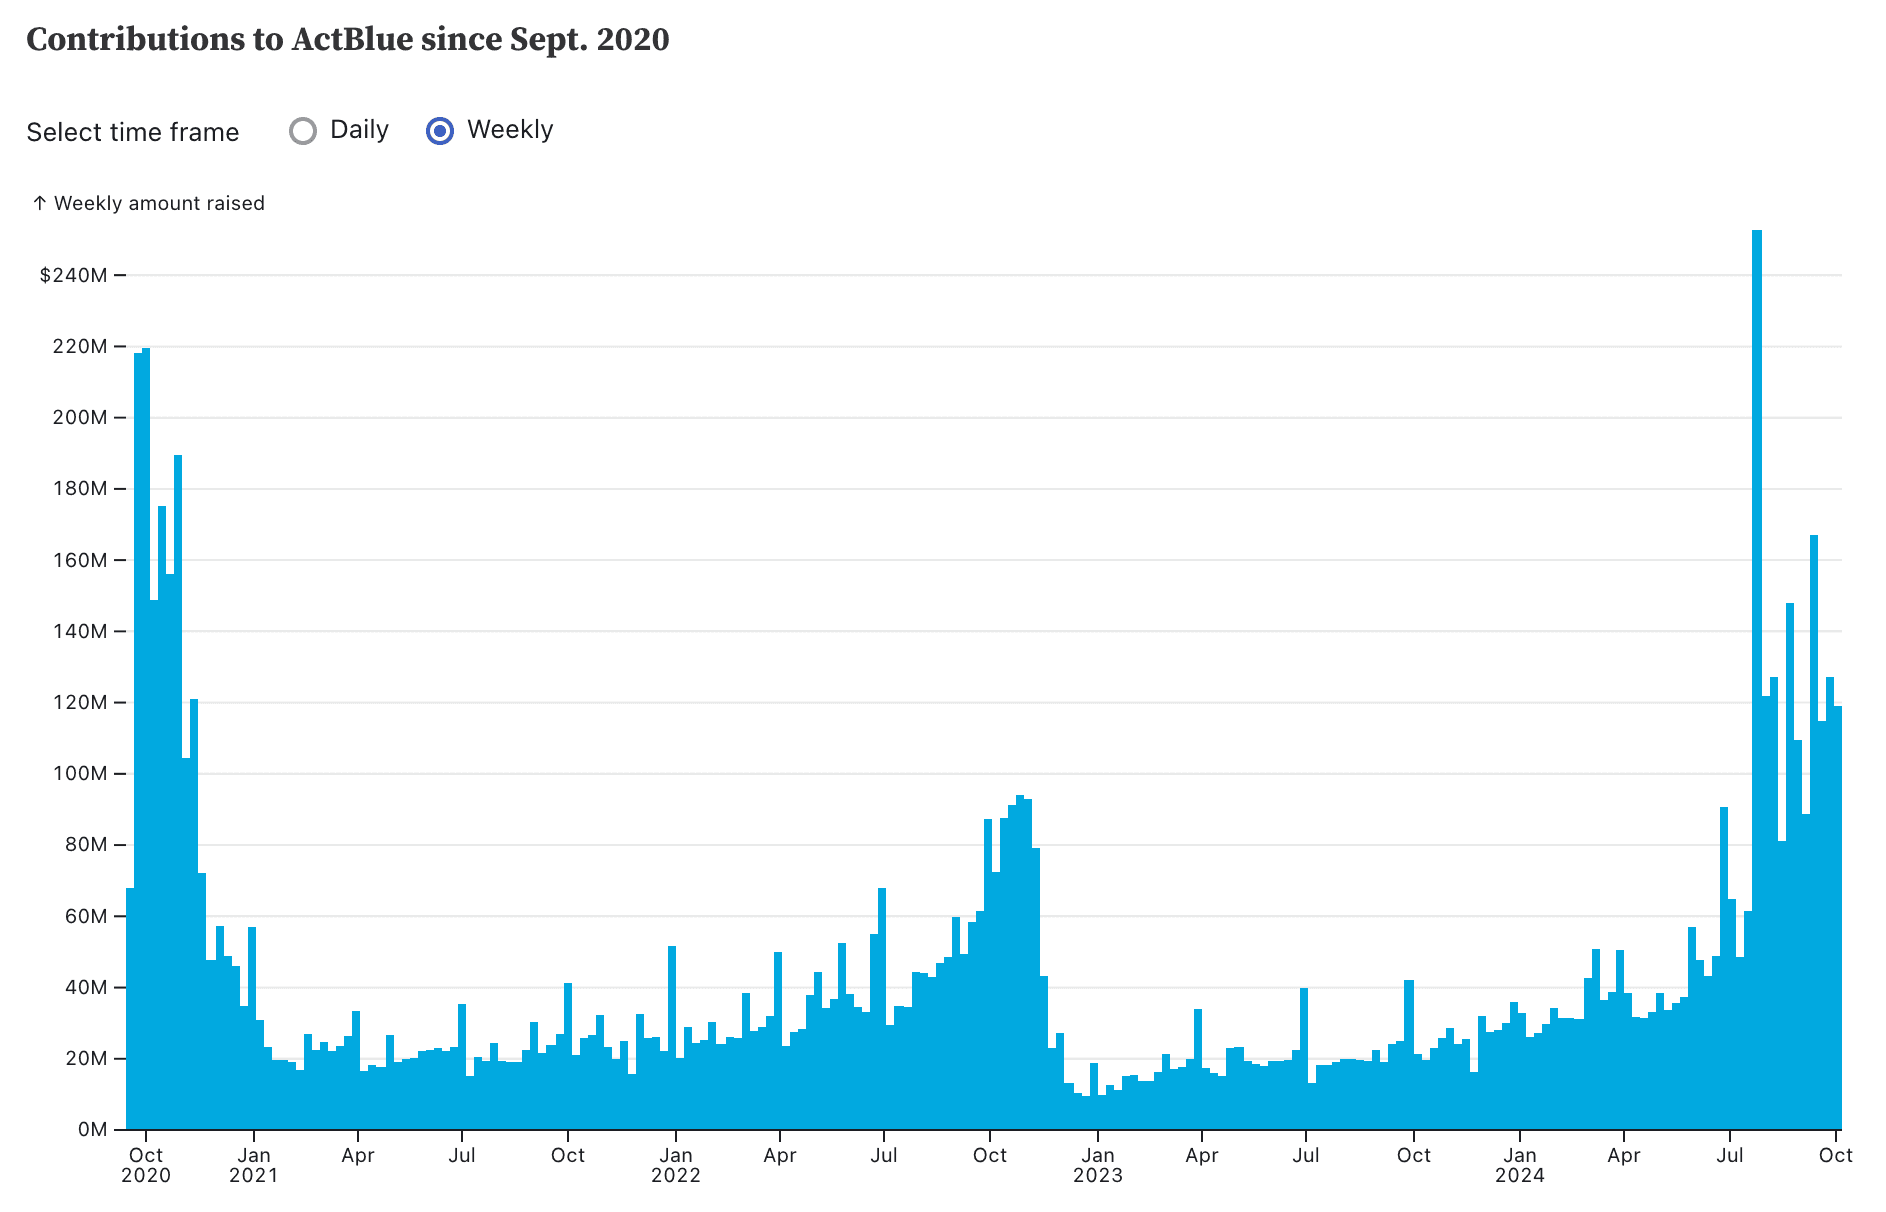
ActBlue contributions since September 2020, as visualized in Ryan Murphy's ActBlue Ticker Tracker.
We reached out to Ryan, a former data journalist and now a seasoned developer with The Marshall Project, to learn more about the inspiration behind this tool, how it works, and why it continues to capture attention during key political moments.
Q: What inspired you to build the ActBlue Ticker Tracker?
A: Before The Marshall Project I worked at the Los Angeles Times and the Texas Tribune, and in both newsrooms I specialized in election and campaign finance coverage. Even though I’ve drifted away from that in my current day-to-day work, old habits die hard and I'm always looking for new opportunities to continue exploring those spaces.
At the top of the ActBlue website they have this giant big number highlighting the total amount raised from ActBlue contributions. I had always thought it’d be interesting to track it: How does it actually change? What is it actually tracking? Is there any logic behind it?
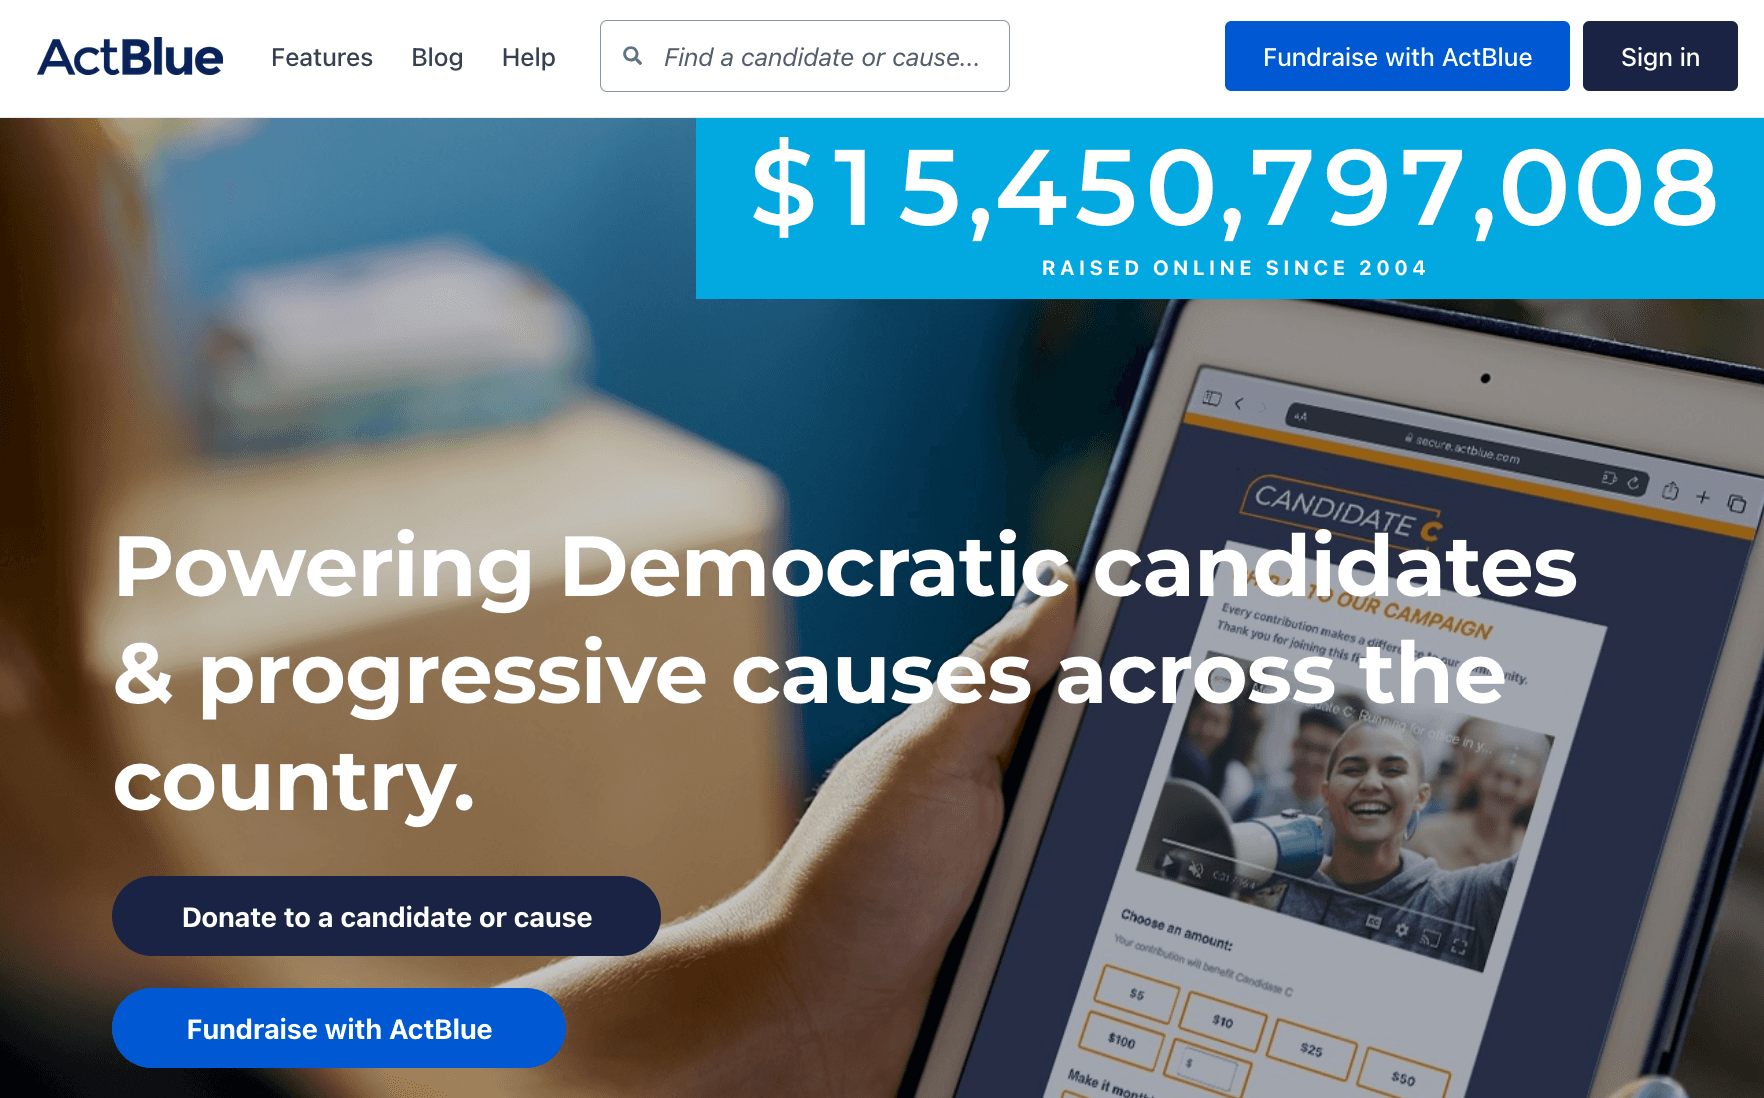
Screenshot of the ActBlue website (from Oct 4, 2024), with the “giant big number” that Ryan’s ActBlue Ticker Tracker has scraped and visualized in an Observable Notebook since September 2020.
I went back and revisited the GitHub repo for the ActBlue Ticker Tracker, and the initial commit was on September 18, 2020. I looked back to see why it was that day that I made this and there actually was a reason! It was the passing of Ruth Bader Ginsburg.
I wish I had a better snapshot of my brain at that point, but my best guess is that I knew there would be a major fundraising push off of Ginsburg’s passing, and I thought if there’s any time to see if this number would change based on current events, it’s now. So I threw together a chart or two so I could revisit the notebook and see how the ticker was updating.
Q: Can you share any “behind the scenes” insights about how you built the scraper to access the ActBlue data?
A: The fascinating thing about the scraper is that it’s very minimal. ActBlue surfaces that number in a JavaScript file. The scraper downloads that file, and I strip out anything that’s not the contribution total and then I commit it on GitHub. Then I run a script powered by a GitHub Action that checks the git history of changes and builds a CSV based on the diff. So there’s this giant CSV getting a new row appended to it every time the value changes.
The script is intentionally as simple as it can be. I wanted to remove the opportunities for me to be clever and break it.
See Ryan’s ActBlue Ticker Tracker code on GitHub.
Q: Why did you choose to use Observable for this project?
A: Across my career I’ve built my fair share of dashboards and static sites. I could have built this project outside of Observable, but I would have also been building the infrastructure of a house that I didn’t really need to build. I knew I could do it if I took the time but Observable was already there and a good fit for this project.
Another benefit is that I can share a notebook and post it to socials (or wherever), where other interested people can see it. With Observable you can quickly build a tool and let people use it. If they want to see how I prepared the data or built the charts they can see the code right there. I’ve built other notebooks where users can drop in their own data. I think that’s always been a really powerful feature!
Some of that doesn’t necessarily apply to the ActBlue Ticker Tracker, but it was a big part of why I was drawn to Observable. The GitHub scraper was the higher priority just to get the data pipeline in place. But to have somewhere where I could see in real time the updates coming through was nice.
That was also one way we used Observable at the LA Times. I was on the team responsible for tracking COVID in California, and we had an Observable notebook where we could see the status and outputs of all of our scrapers. We were also able to share that with people who didn’t care about the code, and they could see those updates without having to understand our hornet’s nest of Python, AWS, etc.
Q: Were you surprised by the notebook’s popularity? Why do you think it continues to draw in viewers?
A: Yeah, definitely! I’ve always been surprised that it has continued to be so popular outside of the original political journalist groups I shared it with.
The ActBlue Ticker Tracker is a rare opportunity to get a close to real-time view of when money is being raised and often you can guess why. When Ruth Bader Ginsburg passed, it was pretty clear cut why ActBlue contributions had spiked. When there’s a debate or major announcements (like when a new candidate is introduced), it’s pretty easy to see the cause and effect.
Again, we do not know who’s getting that money. We cannot say definitively it’s always the Harris campaign raising all this money because many other candidates and political groups also use ActBlue. But you do get this very minor finger on the pulse — it is a brief look behind the curtain that is often very hard to get this early with campaign finance reporting.
Q: What surprises, patterns, or challenges have you realized from building the ActBlue Ticker Tracker?
A: Really just the fact that people keep looking at it — that’s definitely the most surprising thing to me! I kind of expected it to just fade away.
I originally did not have the explanation and caveats at the beginning because I built this primarily for myself and other campaign finance nerds. I assumed most people viewing it had a base level of understanding.
But this year after seeing the ActBlue Ticker Tracker again get a lot of attention I felt an obligation to be clearer about what it actually is. For example, the biggest thing that people assume is all of this money is going to the Harris campaign. We actually don’t know! It’s a pretty good guess, but we have no way of knowing because ActBlue is a fundraising vehicle for much more than just the presidential campaign.
So this year I made the call that you have to eat your vegetables before you get to see the charts and added a few explanatory paragraphs at the top. I want people to understand that while this is very interesting to look at, there are still so many unknowns. Ultimately the clearest picture will come when ActBlue and the committees file their own campaign finance reports with the FEC.
Q: Anything else you want to share about building reports and dashboards with Observable?
A: I came up in an era of online data journalism where showing your work was valued and encouraged. We’re often drawing conclusions and making significant statements of fact, and it’s important to give people the chance to see how we came to those conclusions.
Observable is wonderful for letting people follow the path you took and see how you reached a conclusion or solved a problem. There are many ways that you can host things on the web and sometimes those will make more sense than Observable. But Observable is great if you want to give people the chance to see your data sources or play with the data themselves (or plug in their own), leave a comment or make a suggestion (I've received a few suggestions on the tracker that were helpful!) or just welcome other people into where your head was at the time.
We’re sincerely grateful to Ryan for sharing his experience and insights with us.
Learn more about Ryan and his work with The Marshall Project, “a nonpartisan, nonprofit news organization that seeks to create and sustain a sense of national urgency about the U.S. criminal justice system.” He can also be found on GitHub, Mastodon, and Bluesky.
See how Observable can help your team build and host custom, interactive data apps and dashboards at observablehq.com.