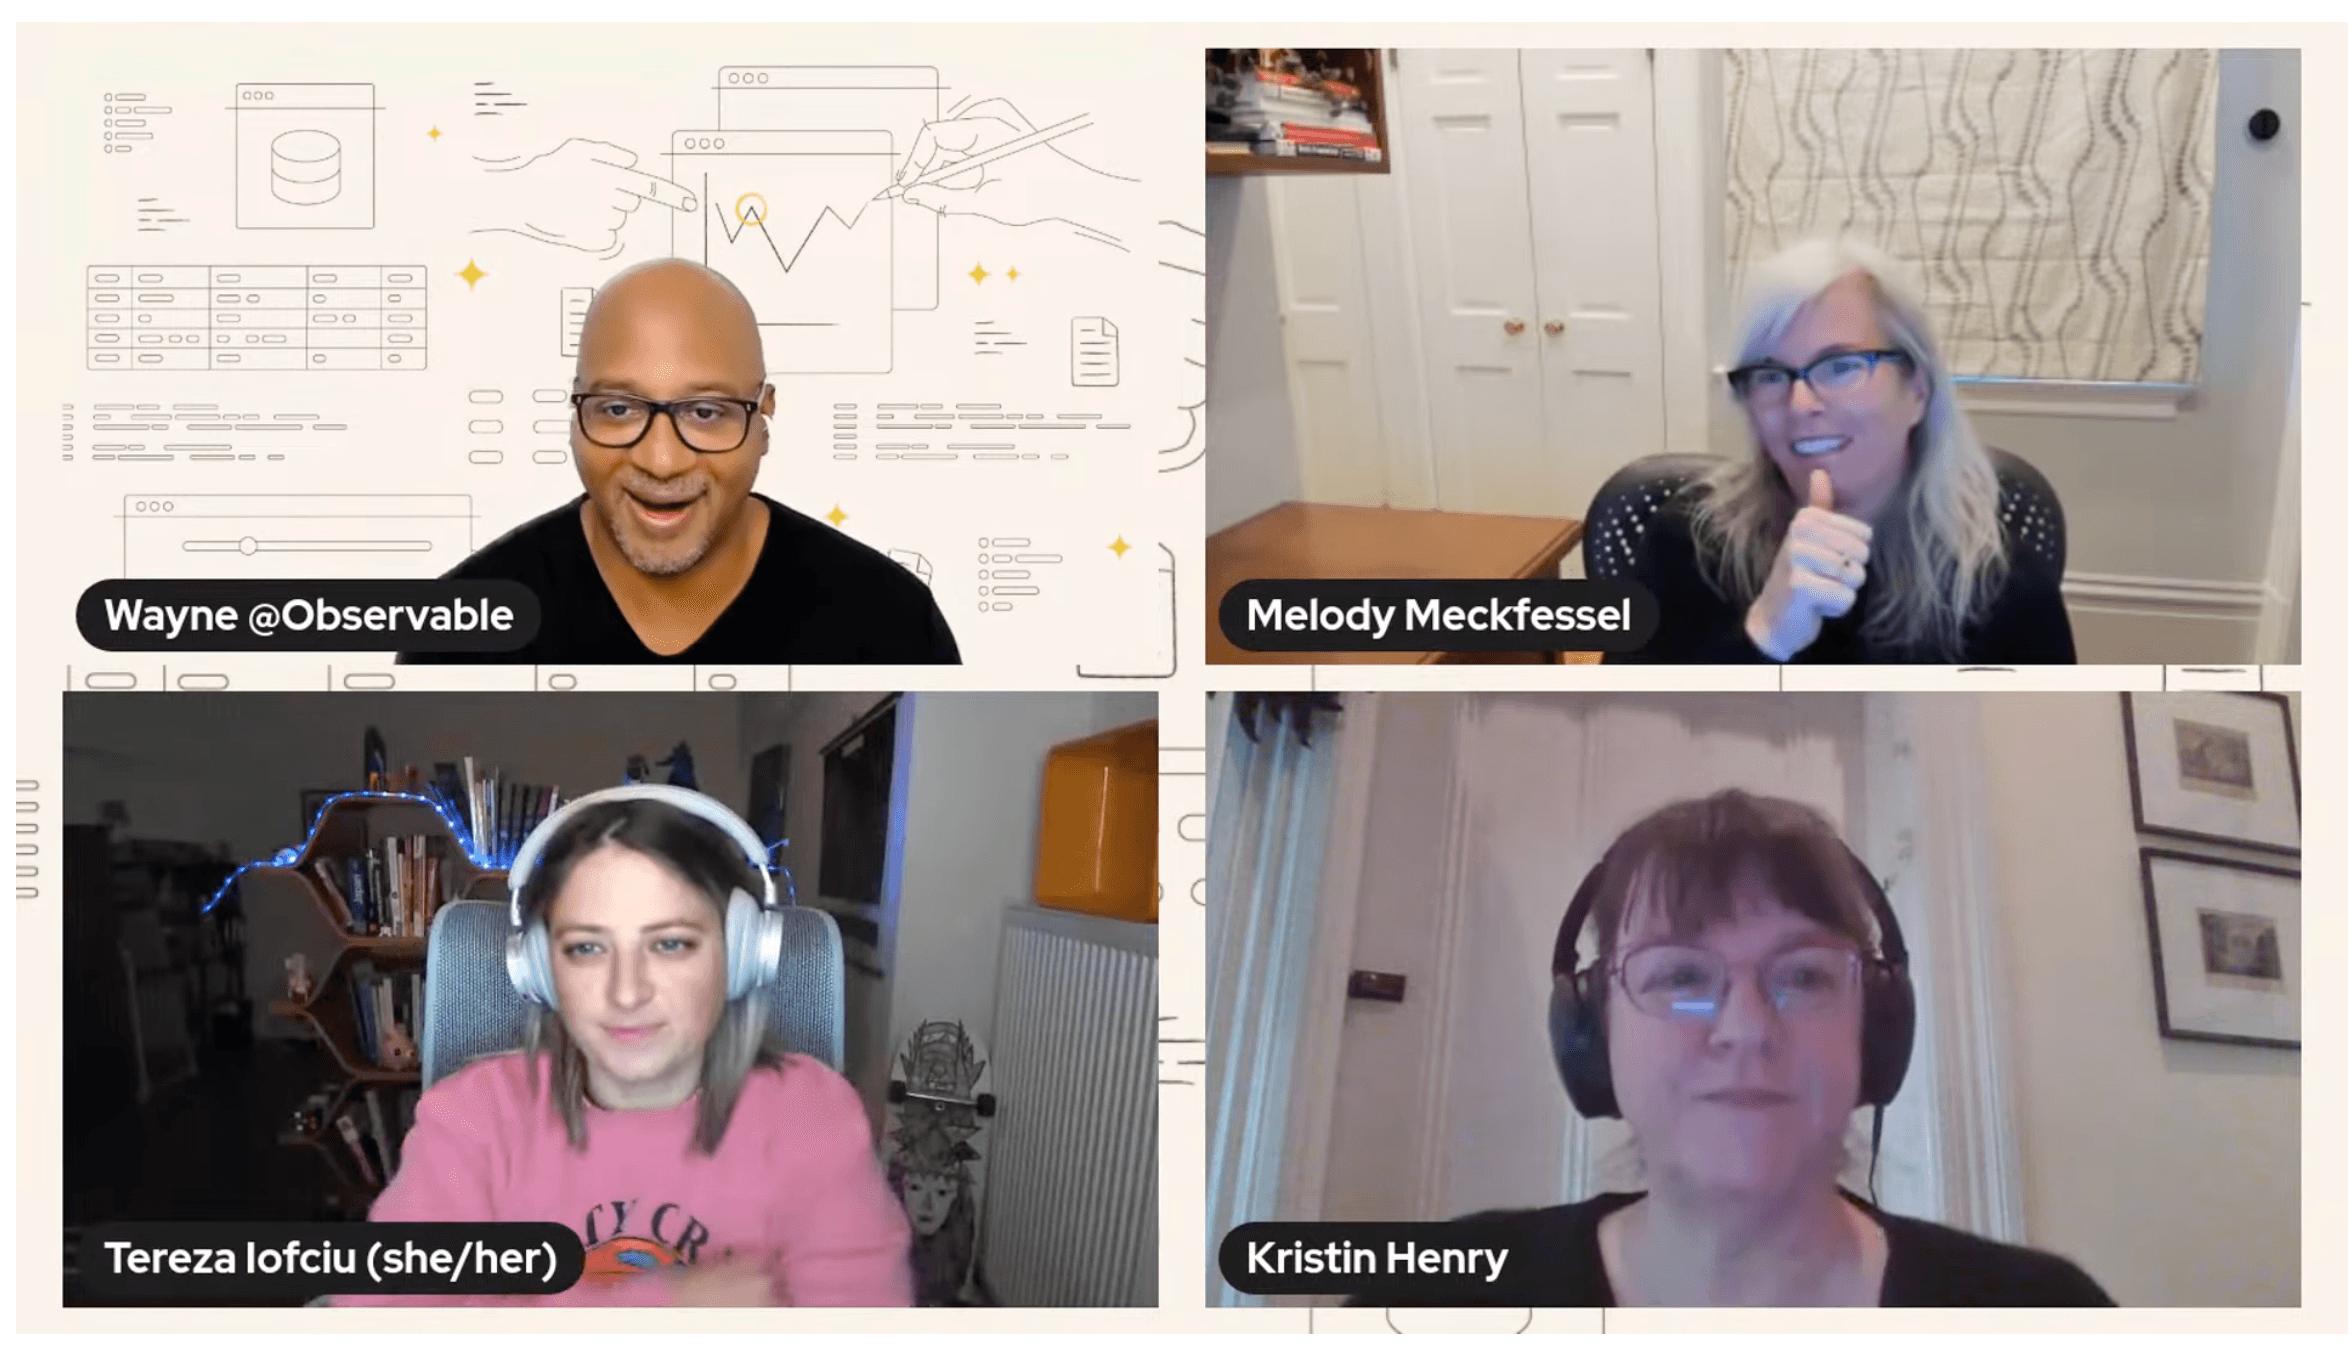
On January 18, Observable hosted “Data Visualization Predictions for 2023,” moderated by Community Lead Wayne Sutton. Industry experts shared their forecasts and hopes regarding dataviz trends, innovations, and workflows.
Guests were Tereza Iofciu, PhD, Head Coach Data Science at neuefische, and Observable Ambassador, Kristin Henry, a computer scientist specializing in Science and Data Visualization, and Melody Meckfessel, Observable co-founder and CEO.
Looking back at 2022
Our guest’s top predictions for the 2023 data visualization space drew from several trends seen in 2022, which were:
Dataviz is more prevalent than ever. Last year, guests saw an increasing presence of dataviz in their everyday lives — in the news media (due to COVID; now here to stay), in jobs (no matter the industry or organization size), and in schools at all levels of education.
An increase in user-friendly dataviz tools. Over the past few years, our experts noted that data tools are becoming more user-friendly, which attracts a higher number of people to the dataviz space. Iofciu said, “Organizations and people have invested in documenting and creating tutorials [for tools], which is so helpful. There were whole fields of dataviz I didn’t touch before because I found them challenging; for example, map creation in Python and D3. I’d just create a default one. Then in November, I discovered a whole new library on Observable, and it made everything easy. This is happening in other areas of dataviz as well.”
Collaboration among diverse skills. People are collaborating in data in ways that they didn’t before 2022. New tools are allowing for increased interactivity, no matter what skills a person has.
Increased adoption of JavaScript, the language of the web. Meckfessel noted the growth in JavaScript use, as well as the fact that people no longer stick with just one programming language, opting instead to learn a variety. “I see former die-hard language fans who are now open to other languages and tools because of the benefit to their skillset.
The people who five years ago said, ‘There's no way I'm going to use JavaScript, ever,’ are now saying, ‘There's more out there and more people using it’ They see how learning and working in several languages lets them grow in different dimensions.”
In JavaScript for Data Analysis, Observable co-founder and CTO Mike Bostock talks more about why the web’s native language of JavaScript is the best choice for exploring data and communicating insights.

Image: Ricky Reusser’s The Double Pendulum Map. Used with permission.
The 2023 dataviz landscape: predictions
In 2023, our panelists agree that we need to guide the multitudes of people, teams, and industries new to dataviz. There are opportunities to help others develop dataviz skills in several ways: with new tools (which may even include controversial AI), with new workflows, and with a combination of documentation and “intentional collaboration.”
The year of helping people new to the space learn dataviz. Iofciu said, “In 2022, the industry helped to solve the technical side, with new tools that more people can more easily use. But here’s what’s not solved: the problem of what to visualize. People with no experience are coming into the field and they struggle with what to visualize. So, in 2023, it’s about helping people understand what dataviz to create, and also helping them to interpret what they created. I think that using the new tools, including AI, we’ll see this in 2023.”
How is Observable helping people understand what dataviz to create, and how to interpret that dataviz?
Check out Explore Observable to see real-world applications of dataviz by field. By browsing our expansive collection of community-created and shared dataviz, you’ll become more familiar with the types of charts and graphs used for certain use cases, datasets, and lines of questioning.
More approachable tools → more industries join the space → more dataviz team collaboration. Meckfessel echoed Iofciu’s prediction that 2023 is the year of helping people accelerate dataviz learning, via their data tools and workflow. “In 2023, we’ll continue to see significant change in making data visualization more approachable … And due to that, we’ll see industries that weren't using dataviz at all, or were using it very little, entering the space. We’ll see more people collaborating around data and using dataviz to tell stories. The tools they use — from data analysis tools to ChatGPT, will influence how people collaborate around data.” Meckfessel added, “We're already seeing new tools come into the data workflow process, as well as the trend of more collaboration within companies. We’re seeing smaller groups of people using visualization to explore. And to address issues of [data] attribution, we’re seeing more language — like annotations and context — behind the data.”
How does working in an Observable notebook support team documentation?
The Observable notebook has several features that support team documentation. With no installation or setup, all team members can be very quickly involved in the team documentation process.
Aside from being able to work in real time as a team with the data, users write notes and comments directly in the notebook. This means that there’s a record of team discussions alongside the dataviz and analysis. Having a clear record in one notebook is preferable to several discussions in various places. For example, if collaboration takes place in Github issues, Slack, emails and elsewhere, it’s a challenge to keep track of it all.
Increased documentation results in more frequent intentional (vs. accidental) collaboration. Iofciu noted that the 2022 trend of hybrid work, especially in the tech space, will continue into 2023. With no one fully onsite anymore, the new way of working has implications for teamwork. Iofciu explained the concept of ‘intentional collaboration’ leading to increased documentation by saying, “I think a cultural shift regarding how people work together will be required. People will get used to documenting more; you can’t be in meetings all the time. As a result, this will lead to more ‘intentional collaboration’ rather than ‘accidental collaboration,’ which has been the case in the past.”
How does Observable support data transparency and governance?
Regarding provenance: to see where data is coming from, use the Notebook Import Visualizer. In addition, you can work with APIs and remote data files on Observable, which opens up a world of data, as well as information about where that data is coming from. Last, regarding data governance, use a variety of database connectors for secure and convenient querying of a variety of databases, including MySQL, Databricks, Snowflake, Oracle, and more.
The 2023 dataviz landscape: wishlist
When guests were asked what one change they would make in the dataviz community, each answered with several hopes. The conversation included data ethics, an “urgent need for best practices”, transparency in data citation and data manipulation, and increased “dataviz accessibility,” which includes alt tags, alt text descriptions, and appropriate color palettes.
Ethics of data work. Henry said, “In 2023, I hope that we'll have more conversations about the ethics of our data, how it's collected, and how we use it.” Meckfessel agreed, saying, “We’re raising questions around ethics and best practices, and asking what our role is in relation to those questions. How can we find ways to bring more transparency, annotation, and description around the work? I’d like to see that evolve in 2023.”
Accessible dataviz. Noting that people who are colorblind cannot study certain dataviz in the scientific world, Henry added, “Accessibility isn't just for extreme accessibility needs, though, it's for all ranges.”
How is Observable addressing accessibility in the product?
-- Colors have been revised to meet WebAIM accessibility standards. In Observable, use JavaScript command “AccessibleChart” and “accessibleDataTable” and more, as outlined in user Didoesdigital's notebook Accessible Bar Chart and Accessible Data Table.
-- Observable user Frank Elavsky has created several helpful notebooks, including Introduction to Accessible Contrast and Color for Data Visualization.
-- Users may opt to add ARIA labels, an attribute that provides a label for objects that can be read by assistive technology. Observable user Kate Hollenbach's notebook Accessibility and Observable Plot.
-- Users may also add descriptions in Observable Plot.
Best Practices. Ioficu mentioned the importance of citing data sources, labeling axes, and clear written interpretations of dataviz. Henry agreed, adding “I see an opportunity for Observable, with more people using dataviz. Observable has the power to guide with dataviz best practices. The Observable community supporting best practices in 2023 has me really excited.”
Meckfessel added, “In dataviz, there is a generosity of spirit, of behaving in an inclusive and collaborative way. I'd love to see us collectively develop those practices: code of conduct, as well as standards across industries, roles, and domains.”
Dataviz by industry: 2023 predictions
The consensus among guests was that in 2023, we’ll see more dataviz across all industries. Iofciu summarized why by saying, “With COVID, we saw data visualization become part of how we digest news. I remember when only The Economist had nice data visualizations. Now, newspapers everywhere have beautiful dataviz.” Thus, speakers discussed the implications for, and the responsibilities of, the existing dataviz community.
Increased demand from C-level executives for dataviz. Iofciu said, “I think the news media is going to continue to normalize dataviz for all of us, as well as give a push for data literacy in the top layers of companies. And that's when C-levels will say, ‘Oh, I want to see how it looks,’ rather than ‘Write me a report.’ Because complex topics are easier to explain and understand through data visualization.”
Offer all industries flexible ways to work with data. Meckfessel explained, “A pharma company and an auto company both say they need more expressiveness in how they look at their data, but they’re not sure where or how to start. I think we can offer more flexible ways to work with data. As a starting point for them, we can offer simple charts with stories around them, annotations, and descriptions.”
How is Observable helping people who are new to dataviz get started?
Our course "Learning Observable" provides an intuitive introduction to all knowledge levels. You'll learn about the core methods and tools to quickly get started working with your data in Observable. There are also plenty of links to more in-depth information.
Data Analysts will continue to become more technical. Meckfessel predicts that as the field becomes more approachable, “we’ll see more companies, even small ones, adopt dataviz,” adding, “They may not have data visualization developers in their org, but their data analysts have become super technical. Data analysts have taken on a developer role in some ways. They're learning various ways to work with data visualization.”
How is Observable helping Data Analysts level up their dataviz?
Our collection "Learn Just Enough JavaScript" helps Data Analysts who mainly use, for example, spreadsheets. In this way, Data Analysts can harness the power and ubiquity of JavaScript to quickly create dataviz that more clearly tells their data story — to all audiences.
Observable community use: 2023 predictions
When asked how she anticipates the community's use of Observable to change in 2023, Meckfessel highlighted a few distinct ways.
Accelerated collaboration “Data visualization, just like writing software, is a team sport. We learn from each other, we build on each other's work. Good things happen when we're curious and we're listening and we're collaborating. I think that is going to continue to accelerate.”

Source: @kelleyvanevert
Collaboration by 5 or more people. “In 2022, we saw more people collaborating with data in groups of five or more. I think we’ll continue to see that in 2023. They’ll accelerate in their collaboration — to explore, analyze and manipulate data, and to connect to multiple data sources in the same notebook.”
An increase in interactivity. “Interactivity is a big part of working with data. Being interactive in the notebook opens up the opportunity for others in the organization to comment on the data, ask questions, build upon someone else's work, and do real-time editing.”
Each role will be more impactful to the organization as a whole. It follows that collaboration and interactivity help every person working with data to do their best work.
The data analyst role is more visible, and more important. “The analyst's role is incredibly important. Data analysts, financial analysts, business analysts. By using Observable, how they think about data is now part of that collaboration. They're not left out, with their own specialized tool, where they just do their own analysis. They’re part of the collaborative team working in a notebook.”
The data scientist collaborates with people who have skills that are unique from theirs. “Data scientists are likely going to continue having specialized tools for their workflow. But now, they get to bring that tool into a larger conversation in a collaborative way. I think this will keep happening for all roles who work with data.”
“A personal passion of mine is to continue to break down barriers. To make this technology even more helpful to people’s work, to their day-to-day lives. How do we make things more approachable so more people can be empowered around data in their careers, and in their lives?”
-Melody Meckfessel, co-founder and CEO
Advice for a career in dataviz
Our guest experts shared invaluable advice for those considering a career in data visualization. Each person emphasized the importance of finding and joining the supportive and inclusive data communities that already exist. Then, each gave their unique spin on how best to approach dataviz as a career path.
Empathy. Henry emphasized an audience-first approach to dataviz, saying “I think the most important tool is empathy. For the person looking at or reading or consuming your visualization, what task do they need to accomplish? Do they have to make a decision? Do they have to notice that something's in the warning zone, and action needs to be taken? Or do they need to absorb information and just learn? I mean, I get lost in the rabbit holes of data structures and it gives me so much joy. But the person looking at what I make with that data structure really doesn't care. They just need to see the results.”
Data literacy + curiosity. Iofciu agreed with Henry that when creating dataviz, one must consider their audience, first and foremost. “In the end, the audience is the most important factor in your data visualization. You’re making the dataviz for them.”
She also outlined a two-part structure. The first part: strengthening your technical learning and data literacy skills. She explained, “There are tools to help with that these days, quite a lot of tutorials. And I think once you have the mechanics in place, whatever tool you choose, you ask yourself: what am I going to visualize?”
The second part, says Iofciu, is curiosity. “After the technical learning, I go back to pen and paper. What are the questions I'm asking? Ask yourself a lot of questions and be curious about the data. Start with a hypothesis, and challenge yourself. Challenge what you find, and interpret it in a way that makes sense.”
Be intentional in finding your data people. Meckfessel echoed the ideas of empathy for the audience, and added, “Empathy for yourself too, when you're learning. Because some of this is really hard.” She also offered: “Find that challenge that interests you, and then find all the things related to it that you’d like to learn.”
Regarding the inclusive dataviz communities out there, Meckfessel said, “Be intentional and find the people that you want to learn from. Find your data people from among the multiple communities out there, whether it's by language or domain. You’ll learn from them and with them, and continue to collaborate with them throughout your career.”
Watch the stream on YouTube.