Getting started
Welcome! This tutorial will guide your first steps with Observable Framework by way of a hands-on exercise creating a dashboard of local weather. 🌦️
Framework is three things in one:
- a local development server that you use to preview apps locally during development, with instant updates as you save changes,
- a static site generator that compiles Markdown, JavaScript, and other sources and assets — alongside data snapshots generated by loaders — into a static site that you can host anywhere, and
- a command-line interface for automating builds & deploys so that you can quickly and securely share your app with whomever you like (your boss, your team, the world).
We’ll touch on each of these parts in this tutorial. It’ll go something like this:
First you’ll setup your local development environment by creating a new project. A project contains all the source code needed to build an app. Next you’ll develop: an iterative process where you save changes to source files in your editor while previewing the result in your browser. When you’re ready to share, it’s time to publish: you build and deploy your static site to your preferred hosting provider.
These are just first steps. You can continue to develop apps after publishing, and republish as needed. You can also setup continuous deployment to publish your app automatically on commit or on schedule. We’ll cover these next steps briefly below.
1. Create
Framework includes a helper script (observable create) for creating new apps. After a few quick prompts — where to create the project, your preferred package manager, etc. — it will stamp out a fresh project from a template.
Framework is a Node.js application published to npm. You must have Node.js 18 or later installed before you can install Framework. Framework is a command-line interface (CLI) that runs in the terminal.
If you run into difficulty following this tutorial, we’re happy to help! Please visit our GitHub discussions.
To create a new app with npm, run:
npx "@observablehq/framework@latest" create
You can run the above command anywhere, but you may want to cd to your ~/Development directory first (or wherever you do local development).
This command will ask you a series of questions in order to initialize your new app. For this tutorial, you can simply hit Enter to accept the default values. When you’re done, you should see something like this:
┌   observable create
│
◆  Welcome to Observable Framework! 👋 This command will help you create a new
│  app. When prompted, you can press Enter to accept the default value.
│
│  Want help? https://observablehq.com/framework/getting-started
│
◇  Where should we create your project?
│  ./hello-framework
│
◇  What should we title your app?
│  Hello Framework
│
◇  Include sample files to help you get started?
│  Yes, include sample files
│
◇  Install dependencies?
│  Yes, via npm
│
◇  Initialize a git repository?
│  Yes
│
◇  Installed! 🎉
│
◇  Next steps… ──────────╮
│                        │
│  cd hello-framework    │
│  npm run dev           │
│                        │
├────────────────────────╯
│
└  Problems? https://github.com/observablehq/framework/discussions
And that’s it! Your new app is ready to go. 🎉
2. Develop
Next, cd into your new project.
cd hello-framework
Framework’s local development server lets you preview your app in the browser as you make rapid changes. The preview server generates pages on the fly: as you edit files in your editor, changes are instantly streamed to your browser.
To start the preview server using npm:
npm run dev
Or with Yarn:
yarn dev
You should see something like this:
Observable Framework v1.13.4
↳ http://127.0.0.1:3000/
If port 3000 is in use, the preview server will choose the next available port, so your actual port may vary. To specify a different port, use --port
npm run dev -- --port 4321
For security, the preview server is by default only accessible on your local machine using the loopback address 127.0.0.1. To allow remote connections, use --host 0.0.0.0
Port numbers below 1024 may need admin privileges. For example, to share your preview server on the default HTTP port 80:
sudo npm run dev -- --host 0.0.0.0 --port 80
Now visit http://127.0.0.1:3000 in your browser, which should look like:

src/index.md) after creating a new app.Test live preview
Live preview means that as you save changes, your in-browser preview updates instantly. Live preview applies to Markdown pages, imported JavaScript modules (so-called hot module replacement), data loaders, page loaders, and file attachments. This feature is implemented by the preview server watching files and pushing changes to the browser over a socket.
To experience live preview, open src/index.md in your preferred text editor — below we show Zed — and position your browser window so that you can see your editor and browser side-by-side. If you then replace the text “Hello Framework” with “Hi, Mom!” and save, you should see:

Create a new page
Now let’s add a page for our weather dashboard. Create a new file src/weather.md and paste in the following snippet:
# Weather report

```js
display(1 + 2);
```
To see the new page in the sidebar, reload the page.
If you click on the Weather report link in the sidebar, it’ll take you to http://127.0.0.1:3000/weather, where you should see:

As evidenced by the code 1 + 2 rendered as 3, JavaScript fenced code blocks (```js) are live: the code runs in the browser. Try replacing 2 with Math.random(), and the code will re-run automatically on save. In a bit, we’ll write code to render a chart. We can also use code to debug as we develop, say to inspect data.
Data loader
Next, let’s load some data. The National Weather Service (NWS) provides an excellent and free API for local weather data within the United States. We’ll use the /points/[latitude],[longitude] endpoint to get metadata for the closest grid point to the given location, and then fetch the corresponding hourly forecast.
Create a new file src/data/forecast.json.js and paste in the following snippet:
const longitude = To personalize this code snippet to your current location, edit the longitude and latitude values above, or click the Locate me button above.
Your data loader should look like this:
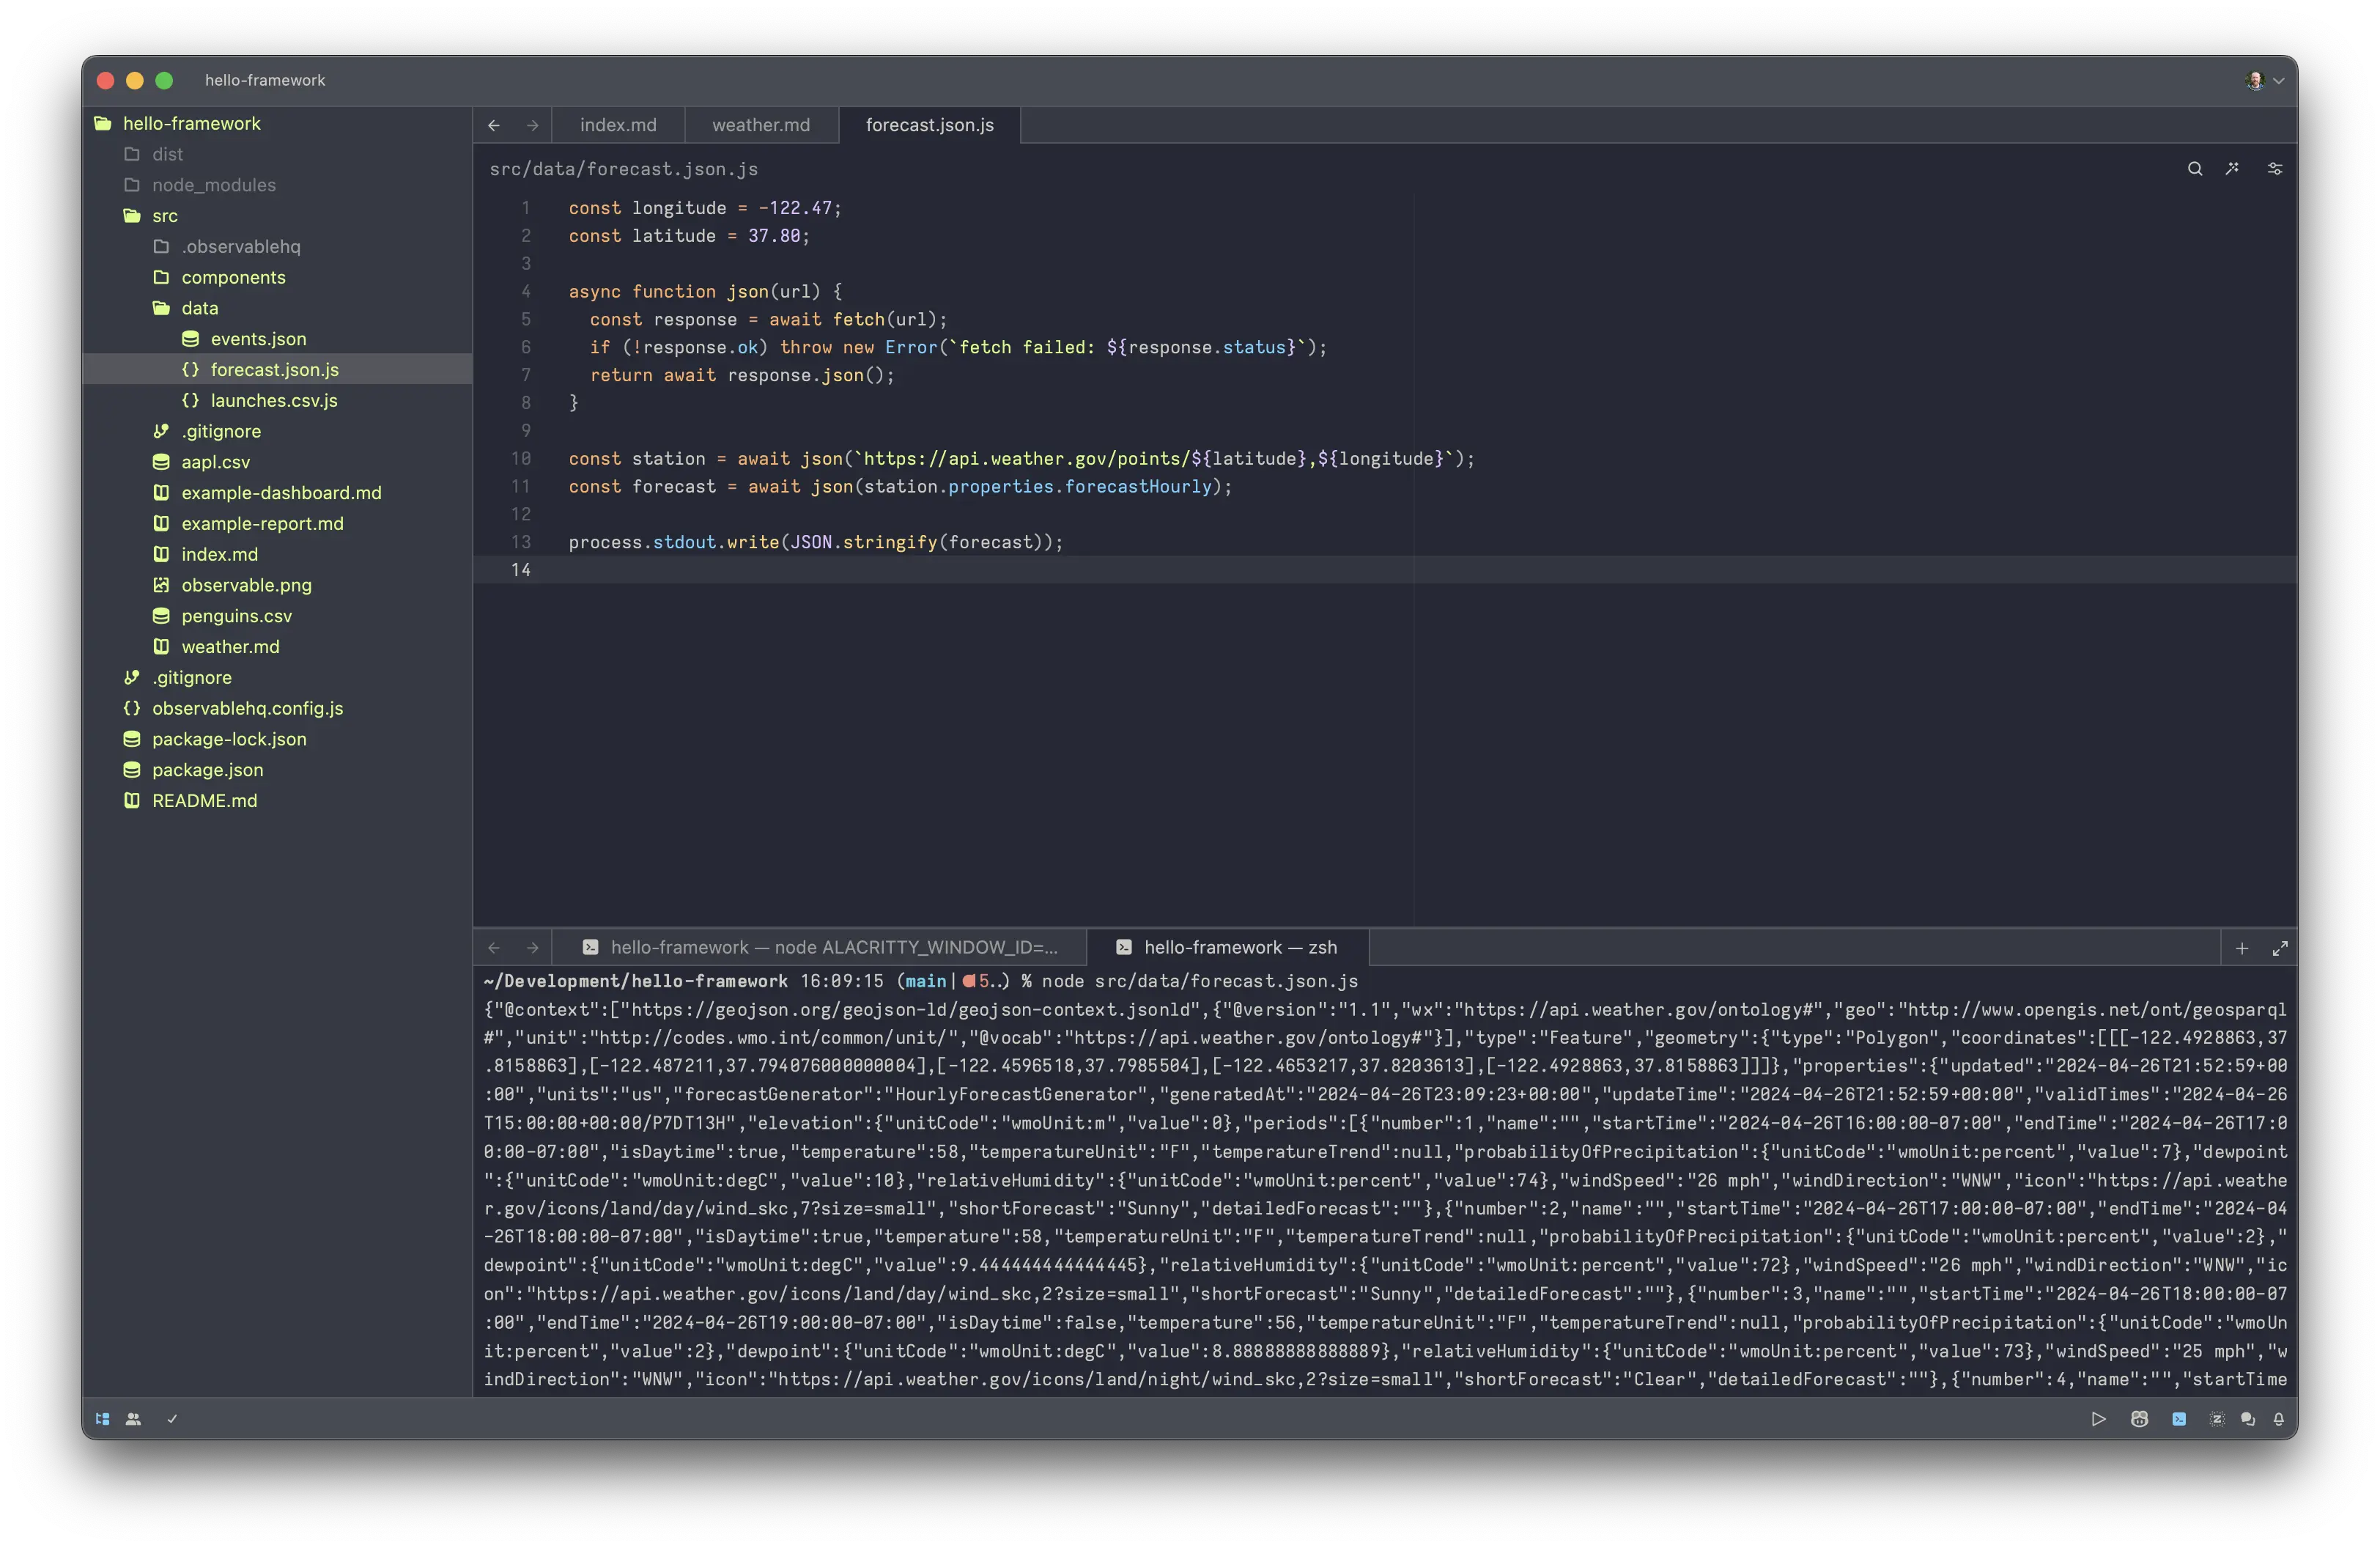
If you like, you can run your data loader manually in the terminal:
node src/data/forecast.json.js
If this barfs a bunch of JSON in the terminal, it’s working as intended. 😅 Normally you don’t run data loaders by hand — Framework runs them automatically, as needed — but data loaders are “just” programs so you can run them manually if you want. Conversely, any executable or shell script that runs on your machine and outputs something to stdout can be a data loader!
File attachments
Framework uses file-based routing for data loaders: the data loader forecast.json.js serves the file forecast.json. To load this file from src/weather.md we use the relative path ./data/forecast.json. In effect, data loaders are simply a naming convention for generating “static” files — a big advantage of which is that you can edit a data loader and the changes immediately propagate to the live preview without needing a reload.
To load a file in JavaScript, use the built-in FileAttachment. In weather.md, replace the contents of the JavaScript code block (the parts inside the triple backticks ```) with the following code:
const forecast = FileAttachment("./data/forecast.json").json();
FileAttachment is a special function that can only be passed a static string literal as an argument. This restriction enables static analysis, allowing Framework to determine which data loaders to run on build and improving security by only including referenced files in the published app.You can now reference the variable forecast from other code. For example, you can add another code block that displays the forecast data.
```js
display(forecast);
```
This looks like:

FileAttachment to load data.The built-in display function displays the specified value, a bit like console.log in the browser’s console. As you can see below, display is called implicitly when a code block contains an expression:
1 + 2
For convenience, here’s a copy of the data so you can explore it here:
This is a GeoJSON Feature object of a Polygon geometry representing the grid square. The properties object within contains the hourly forecast data. You can display it on a map with Leaflet, if you like.
Plots
Now let’s add a chart using Observable Plot. Framework includes a variety of recommended libraries by default, including Plot, and you can always import more from npm. Replace the display(forecast) code block with the following code:
display(
  Plot.plot({
    title: "Hourly temperature forecast",
    x: {type: "utc", ticks: "day", label: null},
    y: {grid: true, inset: 10, label: "Degrees (F)"},
    marks: [
      Plot.lineY(forecast.properties.periods, {
        x: "startTime",
        y: "temperature",
        z: null, // varying color, not series
        stroke: "temperature",
        curve: "step-after"
      })
    ]
  })
);
startTime is a string rather than a Date. Setting the type of the x scale to utc tells Plot to interpret these values as temporal rather than ordinal.You should now see:

Plot to make a chart.forecast.json.js to change the longitude and latitude to a different location! After you save, Framework will run the data loader again and push the new data to the client to update the chart. For example, to see the current forecast at the White House:const longitude = -77.04;
const latitude = 38.90;As before, the code block contains an expression (a call to Plot.plot) and hence display is called implicitly. And since this expression evaluates to a DOM element (a <figure> containing an <svg>), display inserts the element directly into the page. We didn’t have to touch the DOM API!
Components
As pages grow, complex inline JavaScript may become unwieldy and repetitive. Tidy code by moving it into functions. In Framework, a function that returns a DOM element is called a component.
To turn the chart above into a component, wrap it in a function and promote the data to a required argument. Accept any named options (such as width) as an optional second argument with destructuring.
function temperaturePlot(data, {width} = {}) {
  return Plot.plot({
    title: "Hourly temperature forecast",
    width,
    x: {type: "utc", ticks: "day", label: null},
    y: {grid: true, inset: 10, label: "Degrees (F)"},
    marks: [
      Plot.lineY(data.properties.periods, {
        x: "startTime",
        y: "temperature",
        z: null, // varying color, not series
        stroke: "temperature",
        curve: "step-after"
      })
    ]
  });
}
Now you can call temperaturePlot to display the forecast anywhere on the page:
display(temperaturePlot(forecast));
.js files) that you can import into Markdown. This lets you share code across pages, write unit tests for components, and more.Layout
Let’s put some finishing touches on and wrap up this tutorial.
While this nascent dashboard only has a single chart on it, most dashboards will have many charts, tables, values, and other elements. To assist layout, Framework includes simple grid and card CSS classes with 1, 2, 3, or 4 columns. (You can write more elaborate custom styles if needed, or load your preferred CSS framework.)
For example, here’s a two-column grid with three cards:
<div class="grid grid-cols-2">
  <div class="card grid-colspan-2">one–two</div>
  <div class="card">three</div>
  <div class="card">four</div>
</div>
grid-auto-rows), so consider separate <div class="grid"> containers if you want to vary row height.When placing charts in a grid, you typically want to render responsively based on the width (and sometimes height) of the containing cell. Framework’s resize helper takes a render function returning a DOM element and re-renders whenever the container resizes. It looks like this:
<div class="grid grid-cols-1">
  <div class="card">${resize((width) => temperaturePlot(forecast, {width}))}</div>
</div>
Lastly, let’s apply the dashboard theme and disable the table of contents (toc) using YAML front matter. The dashboard theme allows the main column to span the full width of the window; without it, the main column width is limited to 1152px as appropriate for documentation or a report.
---
theme: dashboard
toc: false
---

dashboard theme.Ta-da! 🎉 Perhaps not the most exciting dashboard yet, but it has potential! Try exploring other data in the NWS forecast and adding more charts. For example, you could visualize precipitation probability.
3. Publish
When you’re ready to share your app, you can quickly build and deploy it to your preferred hosting provider, such as GitHub Pages.
To build your app with npm, run:
npm run build
Or with Yarn:
yarn build
The build command generates the dist directory; you can then upload this directory to your preferred hosting provider or copy it to your static site server for self-hosting. To preview your built app locally, you can use a local static HTTP server such as http-server:
npx http-server dist
.nojekyll file in your dist folder after building. See GitHub’s documentation on static site generators for more.To deploy your app to GitHub Pages using GitHub Actions, read our Deploying guide.
Next steps
Here are a few more tips.
Write a data loader in Python, R, or other language
We coded exclusively in JavaScript for this tutorial, but you can write data loaders in any language — not just JavaScript. Here’s a forecast.json.py you could use in place of the JavaScript data loader above:
import json
import requests
import sys

longitude = -122.47
latitude = 37.80

station = requests.get(f"https://api.weather.gov/points/{latitude},{longitude}").json()
forecast = requests.get(station["properties"]["forecastHourly"]).json()

json.dump(forecast, sys.stdout)
To write the data loader in R, name it forecast.json.R. Or as shell script, forecast.json.sh. You get the idea. See Data loaders: Routing for more. The beauty of this approach is that you can leverage the strengths (and libraries) of multiple languages, and still get instant updates in the browser as you develop.
Deploy automatically
You can schedule builds and deploy your app automatically on commit, or on a schedule. See deploying for more details.
Update Framework
To update your app’s dependencies — in particular when a new release of Framework is available, cd into the project and run:
npm update
or
yarn upgrade
(See the reference for npm and yarn.)
Ask for help, or share your feedback
Please reach out if you have questions or thoughts! You can start a GitHub discussion to ask for help or share your work, or file a GitHub issue to report a bug or request a feature. If you like Framework, please give us a star ⭐️ on GitHub — we appreciate your support. 🙏