Public
Elections
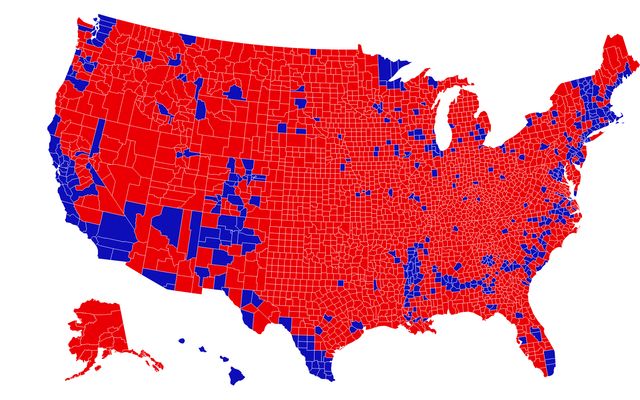
A selection of election-related data visualizations created by our community, the Observable Journalism Network, and our team. Explore maps, voter wait times, paths to victory, and more.
Showing 1-30 of 60 listings


Nov 6, 2020•1

Feb 10, 2023•39 7


May 29, 2024•3

Nov 26, 2020

Sep 22, 2023•5


Feb 19, 2023

Nov 19, 2020•7


Nov 10, 2020•4

Nov 9, 2020•2


Nov 11, 2020•2

Nov 10, 2020•7 2

Nov 10, 2020•5

Nov 6, 2020•33 1


Nov 2, 2020•3

Jul 12, 2024•25 8
Apr 12, 2024•139


Jul 28, 2018•2


Oct 30, 2020


Oct 30, 2020•1
Showing 1-30 of 60 listings