

Analytics
Data appsDEPRECATED
Hosting data apps on Observable Cloud was deprecated on April 15, 2025. We encourage you to migrate to your preferred static site hosting provider. We will discontinue building and deploying of data apps to Observable Cloud on October 15, 2025. Read more →
You can see analytics about the usage of your data app’s pages and exports in the first two tabs of app settings, “Pages” and “Exports”.
The table is designed to emphasize consistent and broad viewership. We show unique viewers, not total views, so that viral spikes don’t drown out steadier drumbeats. The color scale is logarithmic, so that the presence of some views (even by just a couple people) isn’t overwhelmed by one person refreshing a broken page a hundred times. Weekdays with zero views get a faint gray outline, whereas weekends are just blank, to help you see weekly periodicities. Hover over a cell to see the viewer count for that day.
The “Total” column is the sum of the number of unique visitors on each of the last 60 days. (I.e., it is not the total number of pageloads.) A total of “2” might mean two people on one day or one person on two days. If Alice and Bob view your app on Tuesday, and then Alice, Bob, and Charlie view it on Wednesday, then the total for those two days is 5. We call this “viewer-days”, and it represents the sustained popularity of a page or export.
For data apps with many pages or exports, we show the pages with the highest totals at the top.
Parameterized routes are grouped by their source file. There’s currently no way to see analytics broken down by each instance of the route.
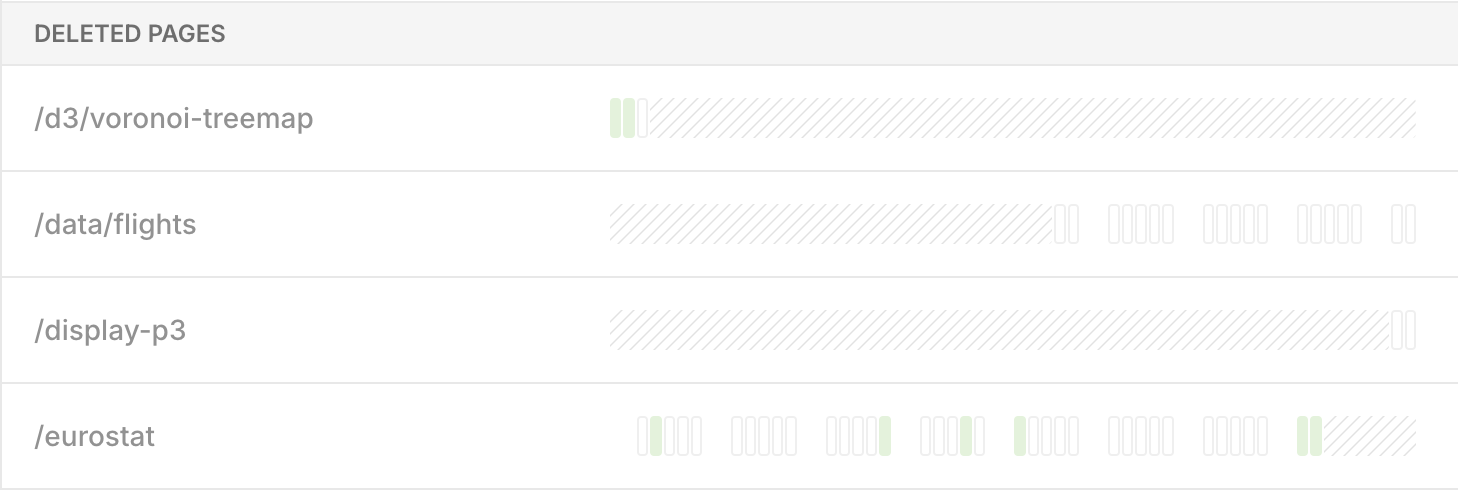
Diagonally hatched areas represent times when a page or export did not exist. When one has been deleted, we relegate it to the bottom; when 60 days have passed it will disappear. Because Observable Cloud understands the structure of Observable Framework, we know statically which pages and exports exist in your app. This lets our analytics distinguish zero views from null views: we know about extant pages with no viewers, and about non-existant pages that had viewers in the past.
All dates are UTC, and data may be delayed by up to a day.
Page analytics
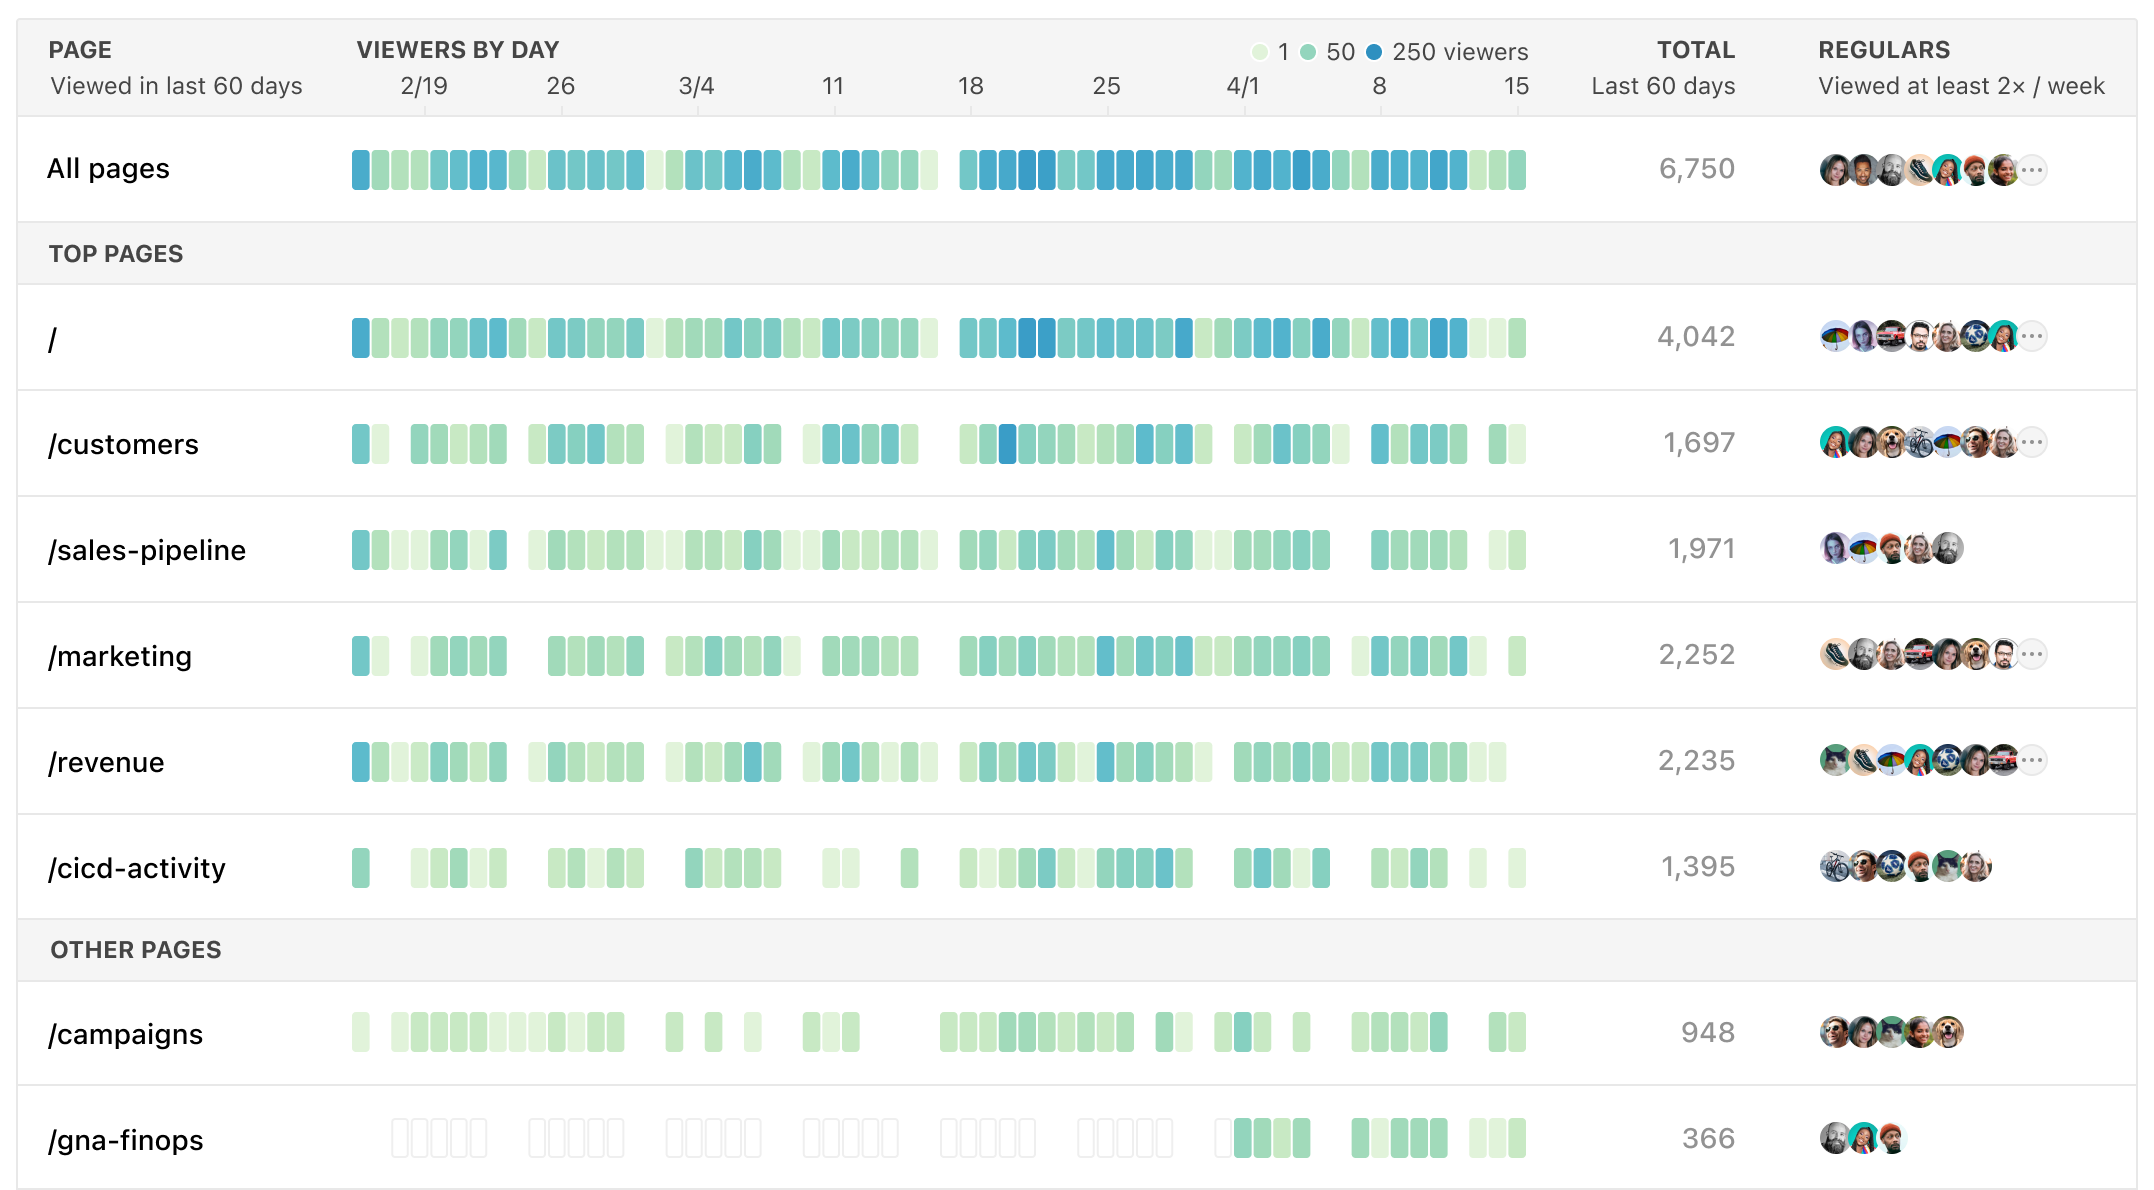
“Pages” shows a heatmap of the number of unique viewers on every page of your data app over the last 60 days. See which dashboards are evergreen, or when reports were popular, or which pages have grown stale and been forgotten.
When you’re building apps for a broad constituency, it helps to know which people or groups are getting value out of different pages. The “Regulars” column shows who has been viewing the dashboard at least twice a week.
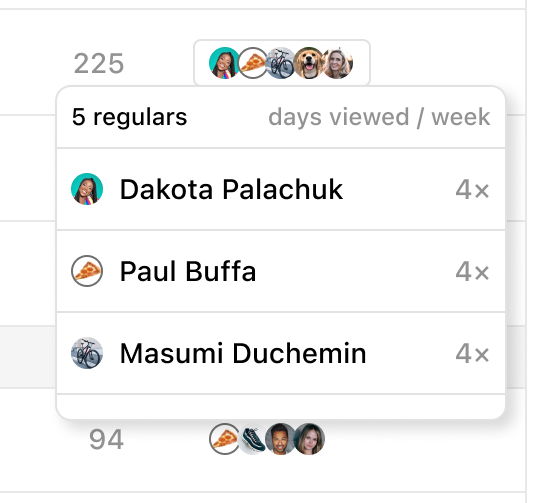
Note that you can only see regulars for members of your workspace. Public data apps don’t track the identity of viewers.
Export analytics
“Exports” shows a heatmap of the number of unique users who have viewed each of your exported modules over the last 60 days. In the case of modules, a view is technically a “run” of the module code.
![A table of exports, with columns “Export”, “Viewers by day”, “Total”, and “Type”, and rows “All exports”, “/app/[id]/[type]/summary.js”, and then, under “Deleted exports”, “/app/[id]/[type]/index.md” and “/app/[id]/summary.js”.](/documentation/assets/exports.DvENB0YI.png)
Since exports are generally embedded in other apps and sites with a different conception of user identities, export analytics don’t focus on the identity of regular viewers; in general, we can’t know who’s viewing the export.
Exported files, like SVGs and CSVs, currently do not support analytics.