What is data wrangling?
Data wrangling is the process of transforming raw data into a useful format for downstream data visualization and analysis. It is a critical skill for data analysts and data scientists because no matter how carefully you collect and curate raw data, further data manipulation is often needed for data to be usable in tasks like modeling, machine learning, business intelligence reporting, and BI dashboard development.
Also called data munging, data cleaning, and data preparation, data wrangling can involve cleaning, joining, reshaping, subsetting, enriching, and validating data. Data wrangling is a crucial step in analysis because it shapes raw data into a clean, structured, reliable format. By transforming and validating your data, you set the stage for more streamlined, accurate analysis that drives strategic decisions and business impact.
In this overview of data wrangling, we describe essential techniques, provide an overview of tools commonly used for data transformation, and consider how AI is changing the data wrangling landscape.
What are common data wrangling techniques?
There is no one-size-fits-all approach to data wrangling. How a particular dataset needs to be transformed is specific to the current shape and state of the data, its intended use, requirements for downstream visualization and analysis, and domain knowledge that informs decisions like how to handle missing values.
That is to say: there are as many different ways to wrangle data as there are unique datasets, topics, and analysis methods.
However, some essential data wrangling techniques show up frequently in data analysis workflows. Below, we describe several of the most common data wrangling steps that you should know.
Joining tables
Business data is often stored across multiple tables that are related to each other in a relational database. Partitioning data into different tables by topic (for example, with sales data in one table, and customer demographics in another) limits repetition for easier and more efficient data management and processing. It also means that the business question you’re trying to answer might require data that is stored across multiple tables.
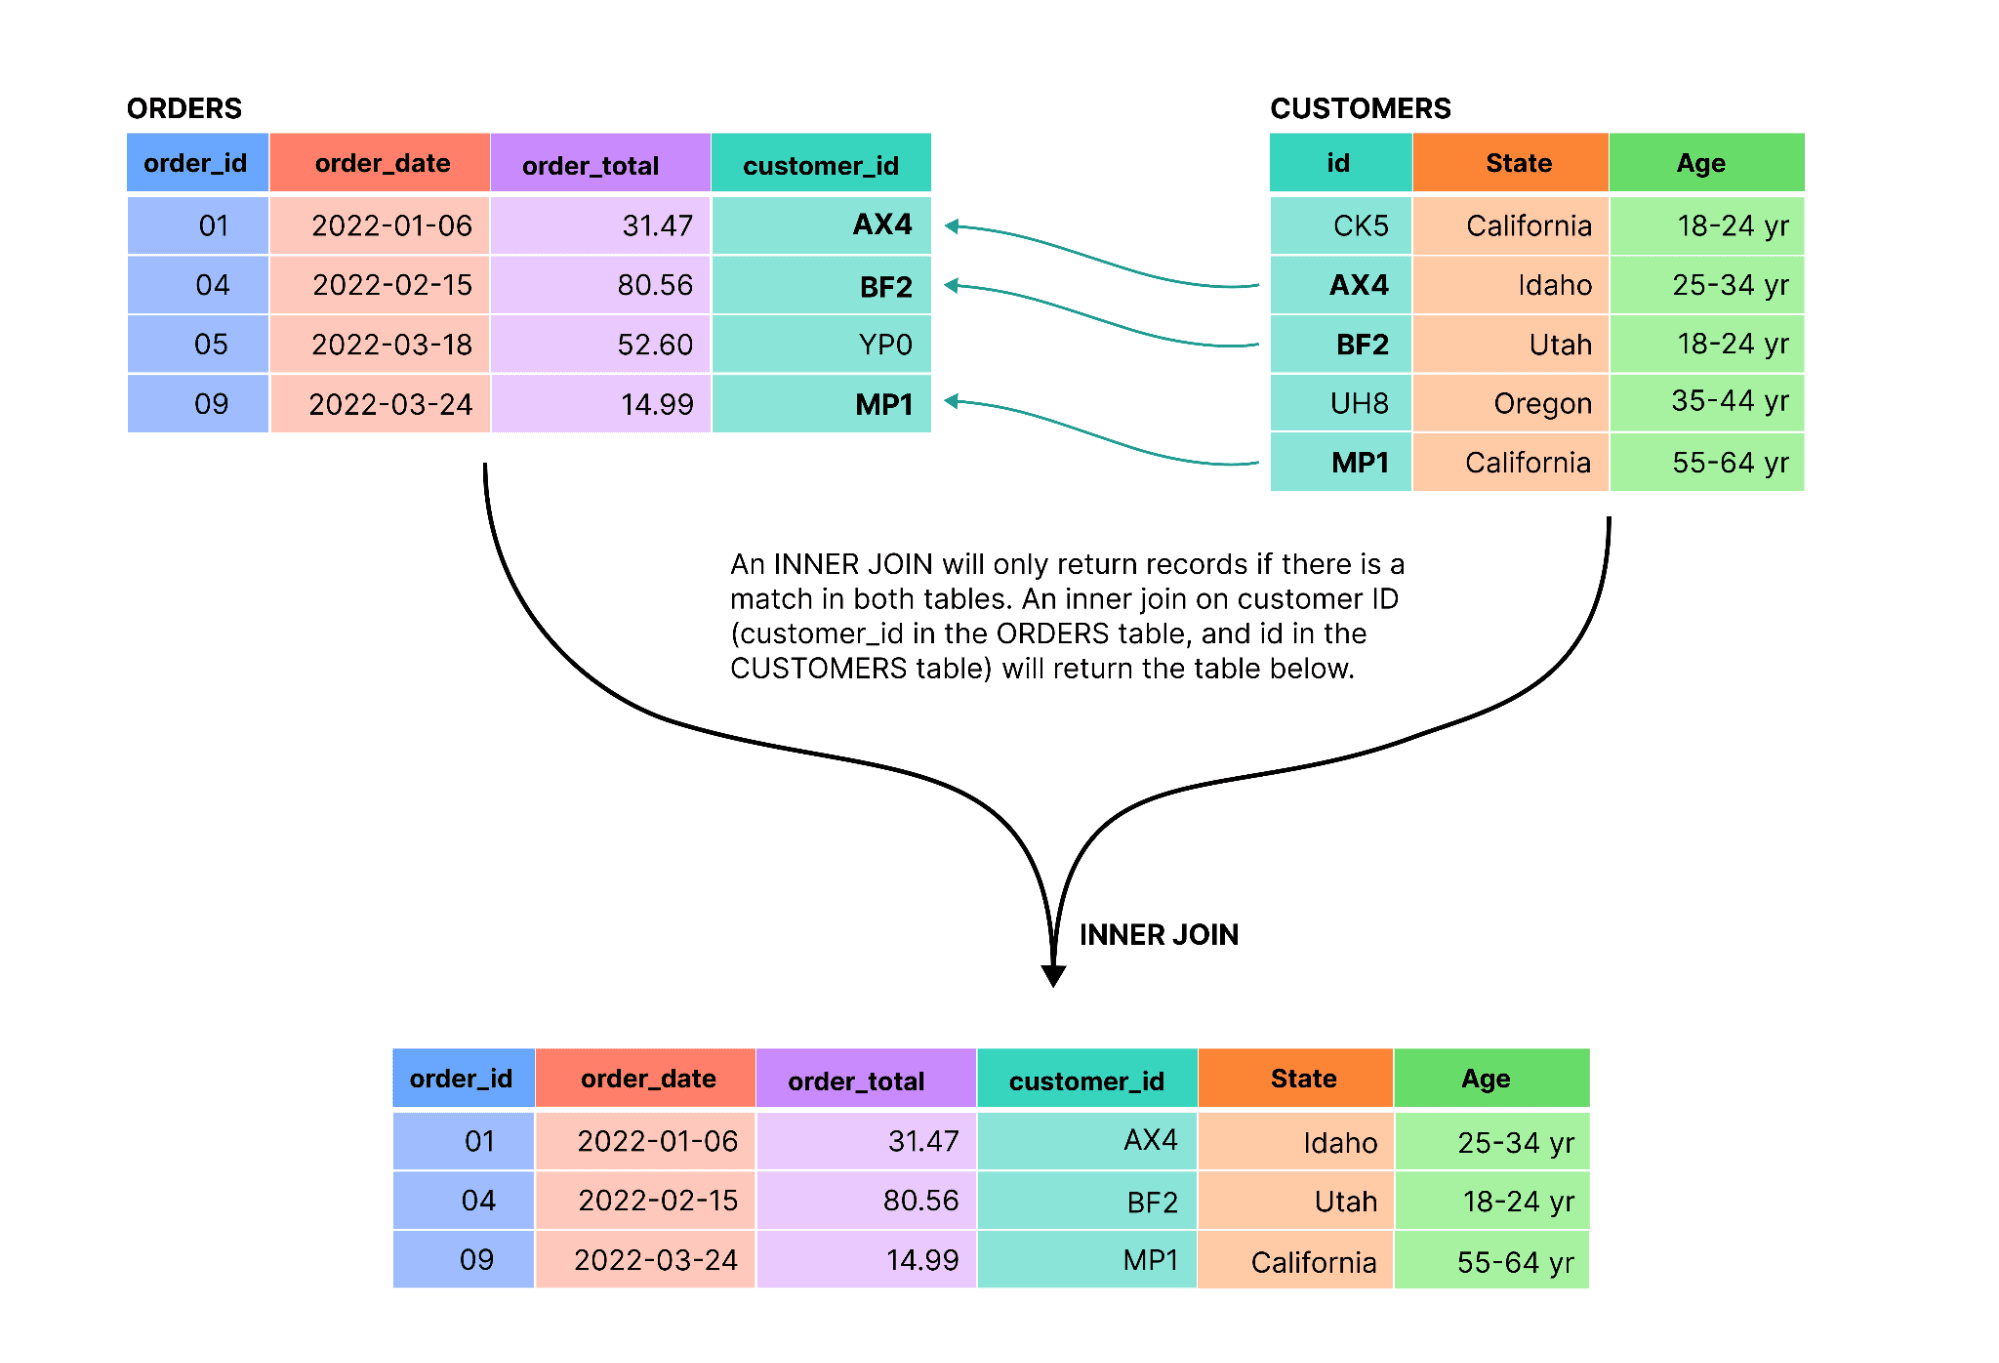
In that case, you’ll want to join the relevant tables based on matching keys. There are different types of joins including full, left, and inner joins. The type of join you choose is important because it determines which rows from each table are included in the final output. For example:
Full join: A full join returns all rows from both tables, whether or not they have a match for the join condition.
Left join: A left keeps all records from the left table, but only joins records from the right table if they have a match in the left table. If a record from the left table does not have a match in the right table, the column values from the right table will be null.
Inner join: A more restrictive join type that only returns rows if there is a match in both tables, as shown below:
Filtering records
Sometimes, you’re interested in analyzing only a specific subset of your data. That might be a limited time frame, a single product tier of interest, or sales for a particular region. Filtering data returns records that match one or more criteria for more focused data exploration and analysis.
Filter criteria might be based on numerical values (for example, to restrict a home sales database to houses sold for over $500k), text strings (limiting to homes where the region field matches “Southern California”), date limits (include sales since January 1, 2022), boolean filters, and more. Often, more than one criteria are applied to create a more restrictive subset based on multiple variables.
Pivoting data
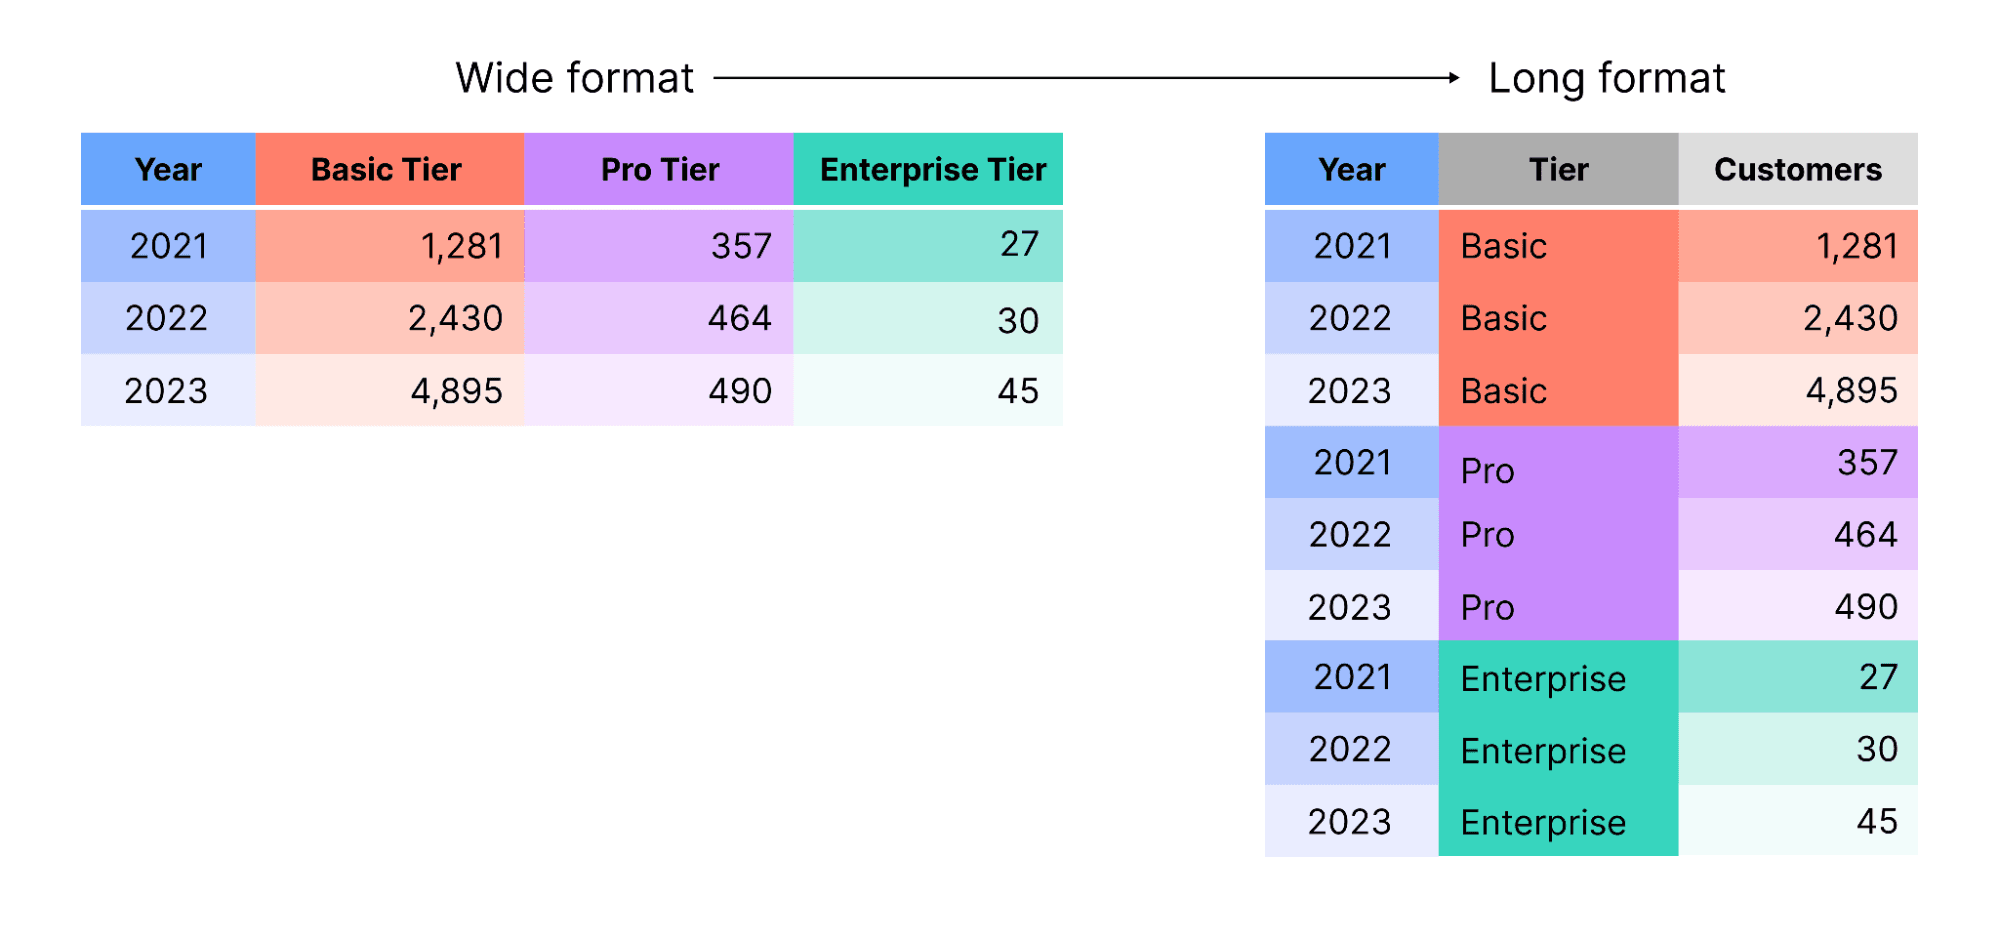
There are different ways to organize tabular data. You might have data in tidy format, where each variable occupies a single column. Or, it may be in a wide format, where values for a single variable are spread across multiple columns.
Depending on downstream tools used, and analyses planned, you might need to reshape your data to get it into a compatible format. For example, Observable Plot (our open source library for data visualization in JavaScript) expects tidy data for most chart types.
You can pivot data to rotate rows to columns, or vice-versa. The schematic below shows the outcome of pivoting customer counts from wide to long format:
Deriving new values
Deriving new values from existing data is an important data wrangling technique because it can streamline downstream analyses and improve interpretation.
There are a number of reasons you’d want to derive new values based on existing data. For example, you may need to combine information about orders with a product price list in order to calculate total revenue across orders. Standardization, normalization, and unit conversions are common operations analysts use to improve uniformity and comparability across variables and data sources.
It’s also common to derive values to represent data at a different resolution than what’s in the raw data. For example, you may want to pull the year component from hourly records, or decide to aggregate continuous age data into ordinal bins (e.g. 0 - 18 years, 19 - 24 years, etc.).
Converting variable types
The variable types that your model ingests can drastically impact outputs, and therefore how you interpret relationships and trends in the data. An important part of data wrangling is to check data types, and when they’re incorrect, recast variables to the appropriate type before using them in analysis and modeling.
One common example is when numbers are used to represent categories, like product or zip codes. These are typically parsed as numbers by default in most software. For example, the zip code 93514 might be stored as the numeric value 93,514, which is incorrect because the code is only a categorical identifier and not a quantitative measure or count. In that case, the zip code variable should be recast as a string or factor (not a number) so it is treated as a categorical variable in downstream analyses.
Handling missing values
Missing values are often overlooked and unexplored during data analysis, with many tools quietly applying listwise deletion by default. That’s concerning because missing values, especially if they are prevalent and non-random, can lead to biased model outputs.
Carefully exploring patterns of missingness helps data analysts to decide on an appropriate strategy to handle missing values. If missing values are infrequent and random, listwise deletion may be a suitable approach. If not, imputation — the process of substituting missing values with reasonable values using methods like hot deck, regression, or multiple imputation — might be a better option.
What tools are used for data wrangling?
There are many different code, spreadsheet, and UI-based tools for data wrangling. The specific tool that a data analyst uses depends largely on their skillset and established team workflows.
Code-first data teams often wrangle data using Python, R, and SQL. In Python, the pandas and polars libraries are commonly used for data manipulation and analysis. In R, a number of packages in the tidyverse, like dplyr and tidyr, provide useful functions for data cleaning and wrangling. Many business intelligence analysts use SQL to join tables, aggregate data, and perform other common data preparation tasks in database queries.
A number of UI-based tools support data wrangling as an alternative to or in combination with code. For example, Alteryx, Tableau Prep, and Microsoft Power Query provide graphical interfaces for data access and transformation. Observable Canvases provide UI options for common data wrangling operations like joining tables, filtering rows, selecting columns, deriving new values, finding grouped summaries, and more. And, data work in Observable Canvases is flexible: users can switch seamlessly between code and UI options across the canvas to best suit their needs and skillsets.
What is the role of AI in data wrangling?
Advances in AI are transforming how analysts work with data, including during data wrangling and cleaning. AI can automate common and repetitive data processing steps, helping analysts get from raw data to higher level analyses, faster. Many tools are integrating AI copilots that can accelerate tedious data preparation tasks.
However, AI-powered data wrangling doesn’t make business analysts obsolete in this stage of the data workflow. It’s critical to carefully inspect AI outputs and understand how data has been transformed before using it in downstream statistical analyses and machine learning models. That’s hard to do when AI works in a black box, which can make it difficult to verify results and raises doubts about data integrity.
Transparency is key to being able to trust outputs of AI-driven data wrangling. That’s why we expose the code, reasoning, and intermediate steps taken by AI in Observable Canvases, allowing users to inspect, verify, and edit AI results. That allows canvas users to confidently use AI to generate complex SQL queries, draft charts, and kickstart new analyses with the comfort of knowing exactly what’s happened to their data along the way.
Conclusion
Data wrangling is a critical skill for data analysts because it makes data reliable and usable for downstream analyses, data visualization, and modeling.
While specific data cleaning and transformation tasks are always project-specific, common techniques include joining, pivoting, filtering, deriving new columns, and handling missing values. Even as AI-powered data wrangling promises to automate tedious data preparation steps, it’s critical that data analysts evaluate the validity of AI-generated results to ensure that data integrity is maintained.