Displays of data have the power to deepen understanding, foster consensus, and shed light on hidden areas of opportunity. The challenge is getting that data in front of users in a way that is both accessible and digestible. Our newest capability allows you to bring rich, interactive data visualizations to your users wherever they are — including in an existing host application — without rewriting your entire application or building a stand-alone data app.
With Observable’s new embedded analytics solution, it’s now easier than ever to integrate visualizations and dashboards built with Observable Framework directly into your applications without compromising on richness of data displayed, end-user performance, or brand continuity.
When we launched Observable Cloud, we set out to solve two key challenges in data visualization: first, the architectural challenge of getting rich data visualizations to load instantly without costly infrastructure; and second, the organizational challenge of enabling data teams to work more independently, free from complex pipelines and with fewer dependencies on external support.
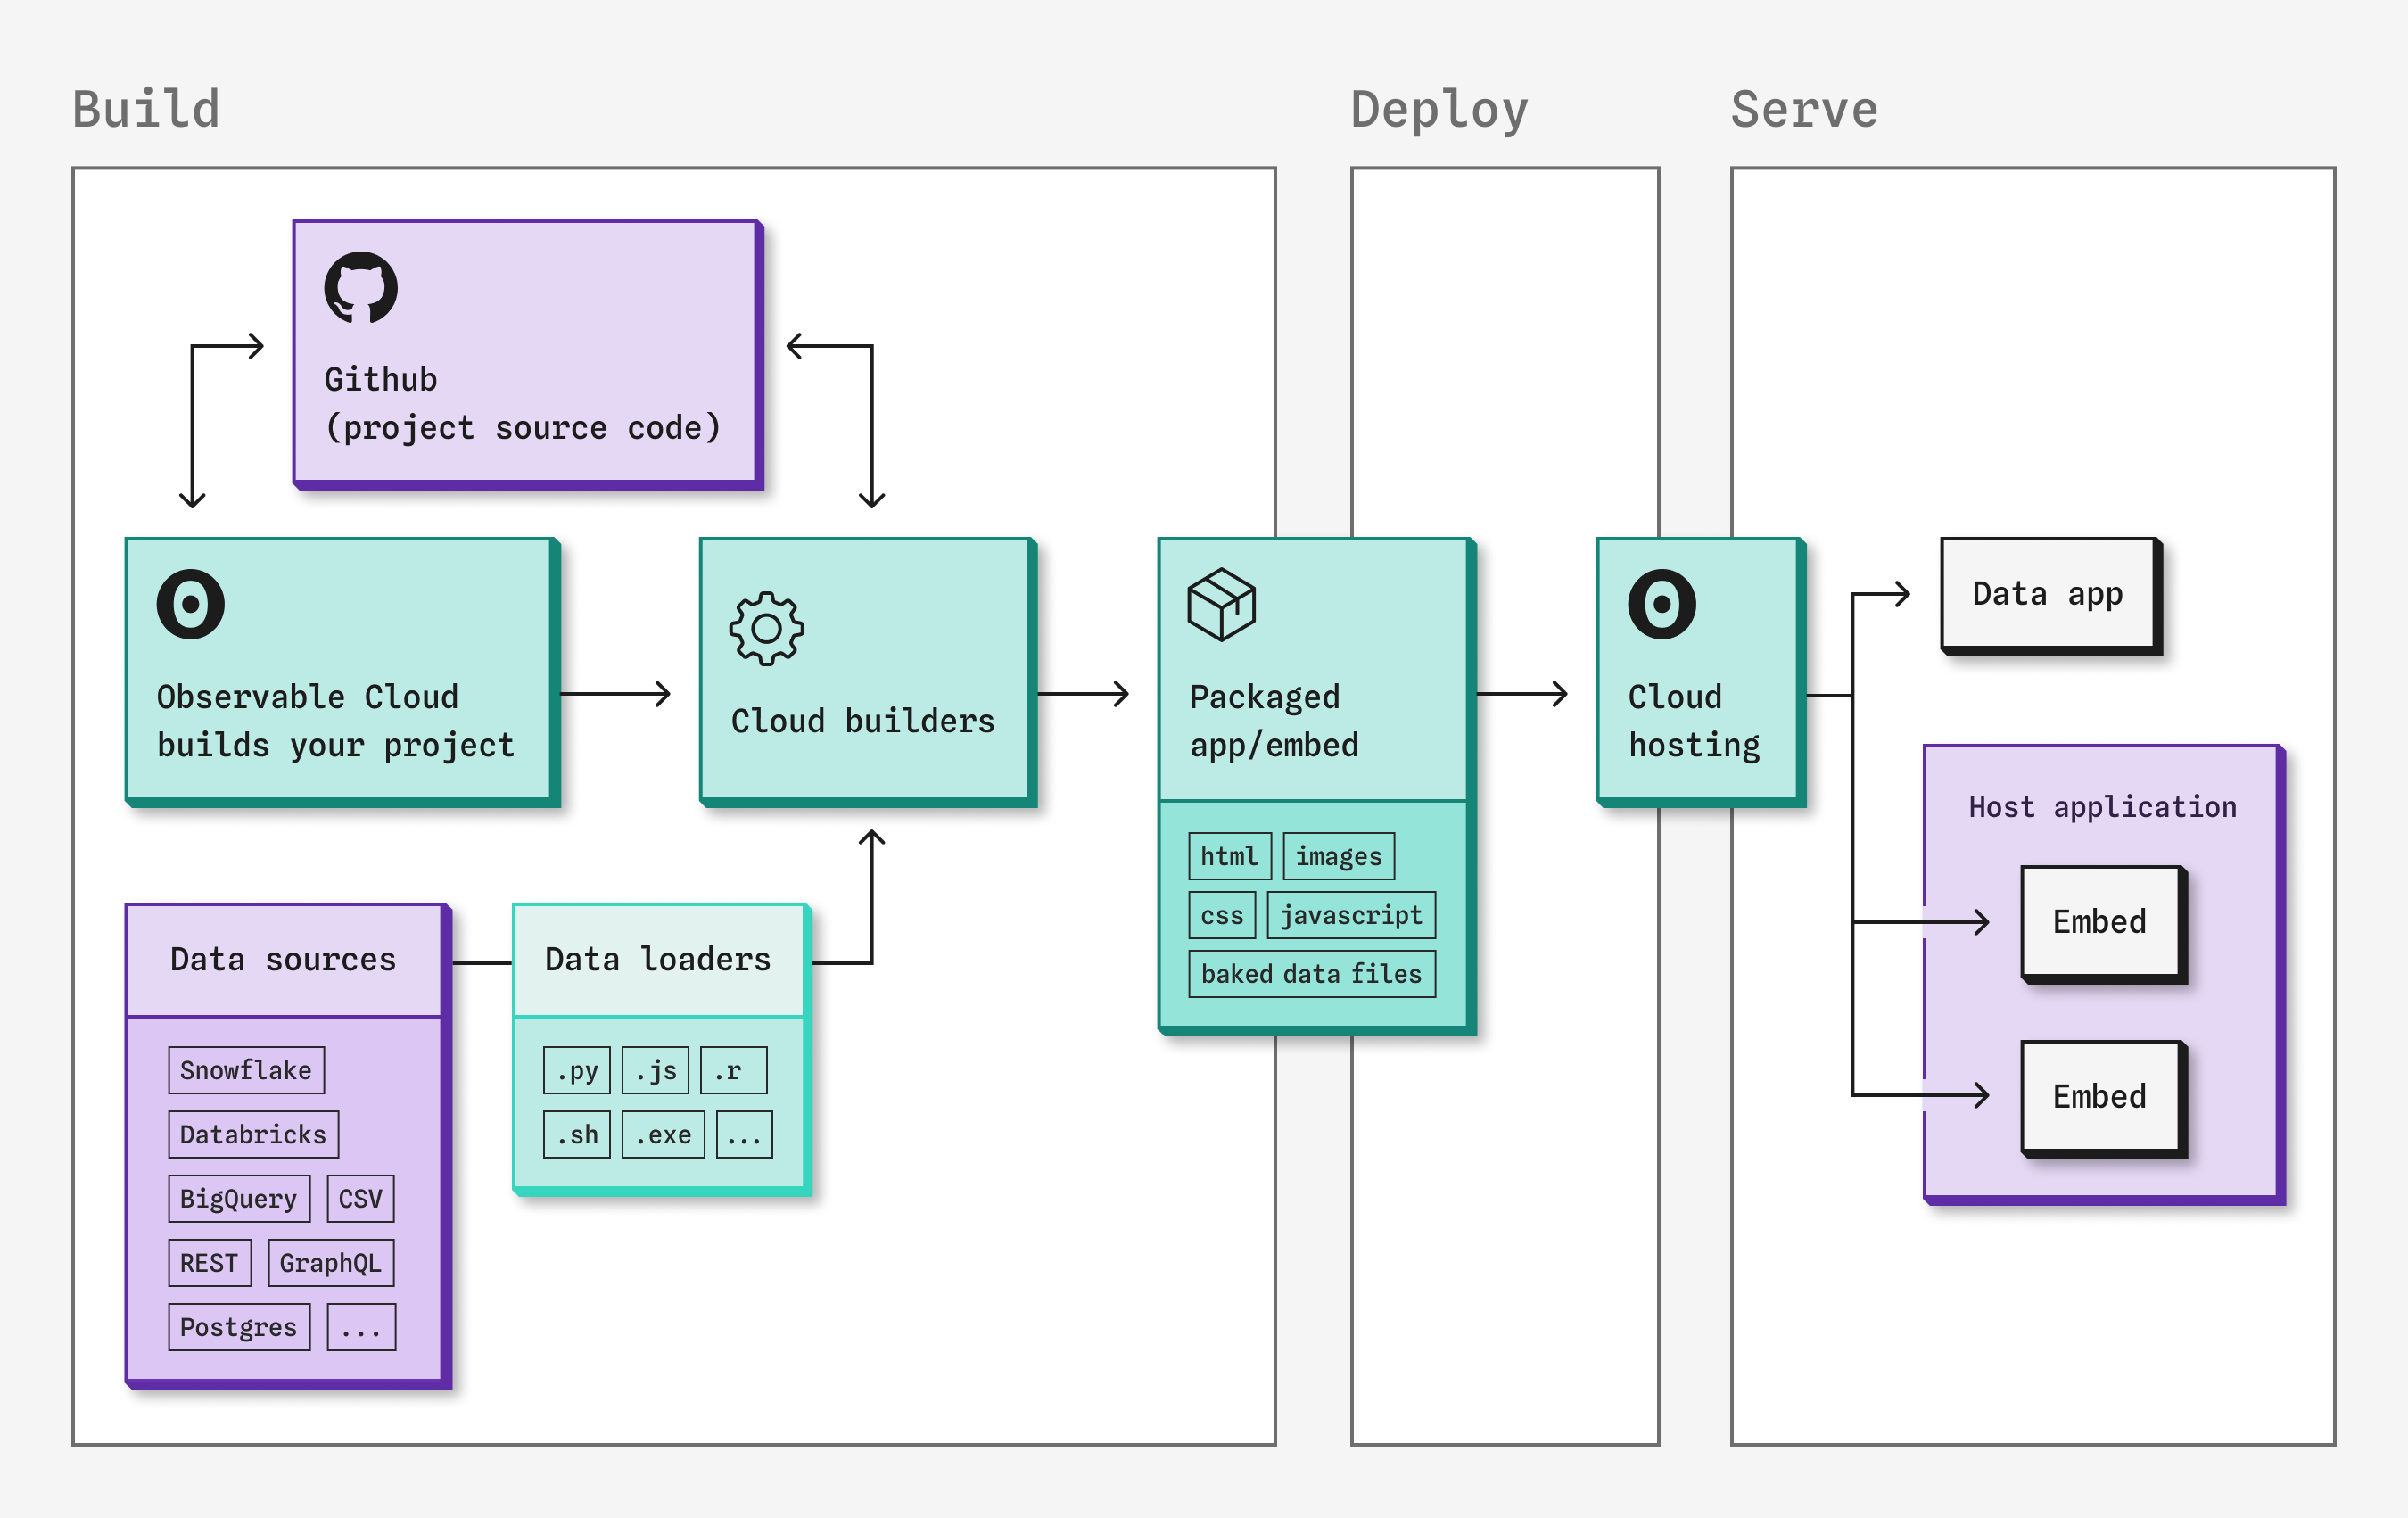
Our support for embedded analytics builds on these solutions, bringing the advantages of Observable’s baked data architecture into your application.
Historically, data teams have had to choose between expressive visualizations and end-user performance, especially when rendering large amounts of data in the browser. Observable’s baked data architecture is purpose-built for the web, delivering highly performant, expressive data apps, dashboards, and visualizations. Precomputed snapshots ensure that displays of data load instantly, while flattened transitive imports eliminate request chains, allowing embeds to load in parallel. This means your visualizations don’t just load faster — they perform better, scaling up to more complex data needs (i.e. larger data sets that display significantly more points of data) without the typical performance trade-offs.
It’s an approach that also makes it possible to leverage the power and flexibility of Observable Framework within existing host applications without the heavy infrastructure costs or implementation delays for rewriting your existing codebase.
Turn your analytics into a competitive advantage
Turn your analytics into a competitive advantage
Unlike other embedded solutions that often rely on SDKs, API keys, or iframes, Observable’s embedded analytics are simple vanilla JavaScript modules. Integrating them into your host application is straightforward — just import an exported module from an Observable Cloud-hosted Framework data app, and you’re ready to go.
<script type="module">
import {Chart} from "https://my-workspace.observablehq.cloud/my-app/chart.js";
document.body.append(await Chart());
</script>
Observable Framework supports multiple integration options, including exported files (for hotlinking images, data, and other assets) and iframe embeds. But exported modules are the best way to ship rich, interactive embeds that integrate natively into your application.
When building support for embedded analytics, we took the opportunity to test our solution for our own project analytics feature. Through this, we experienced firsthand the importance of ensuring that embedded analytics look and feel native to the host application.
To make embedded analytics blend naturally into your application, exported modules allow visualizations to:
Inherit styling: Your visualizations can adopt the colors, fonts, and other styles within your application for consistent UX and easy code maintenance.
Adjust responsively: Embeds dynamically adjust to fit any screen size, adjusting to the viewport on resize and across a wide range of devices.
Enable interactivity: Users can interact directly with the visualizations, triggering actions through event listeners for enhanced functionality and seamless feel.
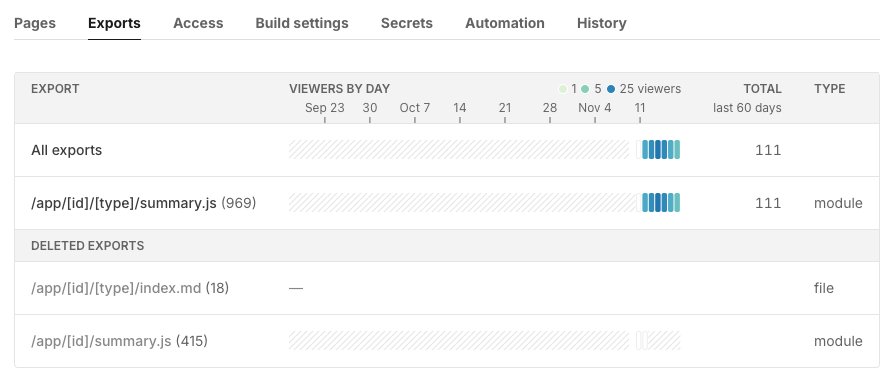
And, because you and your team deserve analytics for your embedded analytics (yes, we’re talking metalytics 👍), export analytics let you see how often each module is viewed across your application, helping you monitor engagement and understand which modules are accessed most frequently.
When developing user-facing experiences, it’s paramount that the correct data is shown only to the correct, authorized users. Observable’s embedded analytics support fine-grained control over data visibility, backed by standard JWT authorization. With parameterized routes, you can control access down to individual views, ensuring users see only the insights they’re meant to, consistent with your app’s permission structure.
Personalization: Use parameterized routes to tailor charts and visuals to each user, providing unique insights at scale.
Multi-domain support: In-app CORS configuration for Enterprise workspaces simplifies cross-domain embedding, allowing you to define access controls across domains for secure and personalized data experiences.
Fine-grained access control: Use secure access tokens and JWT-based authorization to control exactly what data is visible to each user, with permission logic controlled by your host application.
Building new data experiences, or iterating on existing visualizations, can be an expensive time-consuming endeavor. To help accelerate your time-to-market and increase developer velocity, our approach allows data teams to operate more independently, iterating on insights without needing to touch the main application’s codebase. There’s no waiting on CI cycles or wrestling with a monolithic repository. This means updates to analytics are faster, more fluid, and less dependent on the core application’s development flow.
Observable's embedded analytics offer developers and data teams a solution uniquely tailored for today’s data-rich applications. By combining instant-loading visualizations, independent data team management, and deep integration within your application, Observable brings embedded analytics up to the standards of modern, high-performance web development with no compromises.
For a deeper dive into Observable’s approach and to explore embedded analytics in action, visit our overview.

