

Getting started
Observable Plot supports a variety of environments.
Try Plot online
The fastest way to get started (and get help) with Observable Plot is on Observable! Plot is available by default in notebooks as part of Observable’s standard library. To use Plot, simply return the generated plot from a cell like so:
ForkPlot.rectY({length: 10000}, Plot.binX({y: "count"}, {x: d3.randomNormal()})).plot()Observable includes a variety of Plot snippets when you click + to add a cell, as well as convenient sample datasets to try out Plot features. Or upload a CSV or JSON file to start playing with your data. You can even use Observable’s chart cell, which uses Plot’s auto mark under the hood, to create quick charts without writing code! You can then eject to JavaScript by clicking + to see the equivalent Plot code.
Observable is free for public use. Sign up for a Pro account to connect to private databases, collaborate on private notebooks, and more.
Plot in vanilla HTML
In vanilla HTML, you can load Plot from a CDN such as jsDelivr or you can download it locally. We recommend using the CDN-hosted ES module bundle as it automatically loads Plot’s dependency on D3. But for those who need it, we also provide a UMD bundle that exports the Plot global when loaded as a plain script.
<!DOCTYPE html>
<div id="myplot"></div>
<script type="module">

import * as Plot from "https://cdn.jsdelivr.net/npm/@observablehq/plot@0.6/+esm";

const plot = Plot.rectY({length: 10000}, Plot.binX({y: "count"}, {x: Math.random})).plot();
const div = document.querySelector("#myplot");
div.append(plot);

</script><!DOCTYPE html>
<div id="myplot"></div>
<script src="https://cdn.jsdelivr.net/npm/d3@7"></script>
<script src="https://cdn.jsdelivr.net/npm/@observablehq/plot@0.6"></script>
<script type="module">
const plot = Plot.rectY({length: 10000}, Plot.binX({y: "count"}, {x: Math.random})).plot();
const div = document.querySelector("#myplot");
div.append(plot);
</script><!DOCTYPE html>
<div id="myplot"></div>
<script src="d3.js"></script>
<script src="plot.js"></script>
<script type="module">
const plot = Plot.rectY({length: 10000}, Plot.binX({y: "count"}, {x: Math.random})).plot();
const div = document.querySelector("#myplot");
div.append(plot);
</script>Plot returns a detached DOM element — either an SVG or HTML figure element. In vanilla web development, this means you need to insert the generated plot into the page to see it. Typically this is done by selecting a DOM element (such as a DIV with a unique identifier, like myplot above), and then calling element.append.
If you’d prefer to run Plot locally (or entirely offline), you can download the UMD bundle of Plot along with its dependency, D3, here:
Then, create an index.html file as shown above in the UMD + local tab. If you prefer smaller minified files, you can download d3.min.js and plot.min.js, and then update the src attributes above accordingly.
Installing from npm
If you’re developing a web application using Node, you can install Plot via pnpm, npm, yarn, or your preferred package manager.
pnpm add @observablehq/plotnpm install @observablehq/plotyarn add @observablehq/plotYou can then load Plot into your app as:
import * as Plot from "@observablehq/plot";You can instead import specific symbols if you prefer:
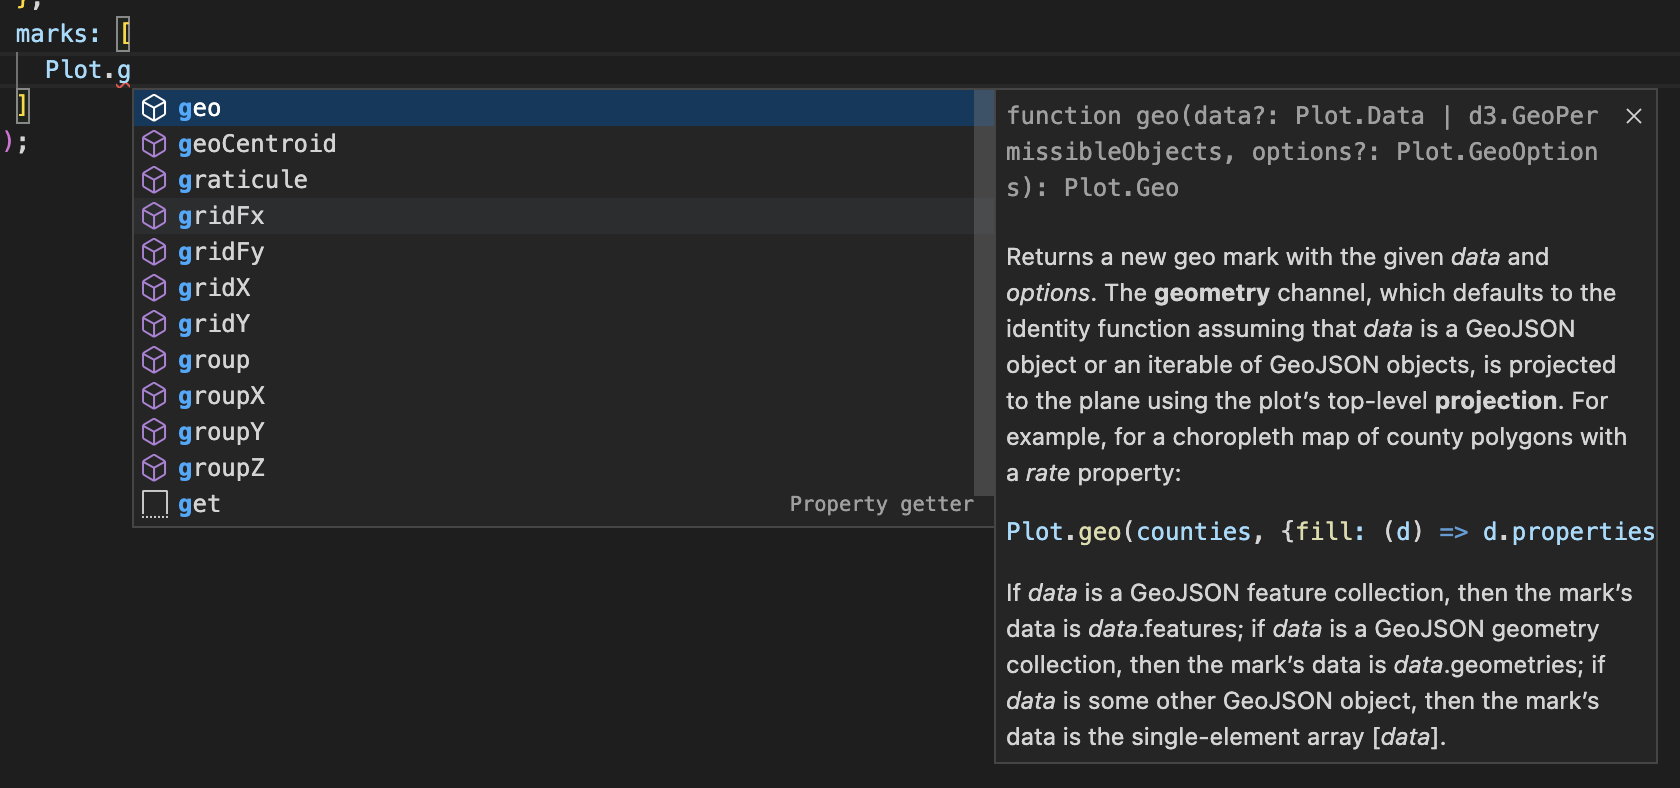
import {barY, groupX} from "@observablehq/plot";Plot includes TypeScript declarations with extensive documentation. We highly recommend using an editor with enhanced code completion such as Visual Studio Code or Observable.
Plot in React
We recommend two approaches for Plot in React depending on your needs.
The first is to server-side render (SSR) plots. This minimizes distracting reflow on page load, improving the user experience. For this approach, use the document plot option to tell Plot to render with React’s virtual DOM. For example, here is a PlotFigure component:
import * as Plot from "@observablehq/plot";
import {createElement as h} from "react";

export default function PlotFigure({options}) {
  return Plot.plot({...options, document: new Document()}).toHyperScript();
}
INFO
For brevity, the virtual Document implementation is not shown. You’ll find it linked below.
Then, to use:
import * as Plot from "@observablehq/plot";
import PlotFigure from "./PlotFigure.js";
import penguins from "./penguins.json";

export default function App() {
  return (
    <div>
      <h1>Penguins</h1>
      <PlotFigure
        options={{
          marks: [
            Plot.dot(penguins, {x: "culmen_length_mm", y: "culmen_depth_mm"})
          ]
        }}
      />
    </div>
  );
}
See our Plot + React CodeSandbox for details.
Server-side rendering is only practical for simple plots of small data; complex plots, such as geographic maps or charts with thousands of elements, are better rendered on the client because the serialized SVG is large. For this second approach, use useRef to get a reference to a DOM element, and then useEffect to generate and insert your plot.
import * as Plot from "@observablehq/plot";
import * as d3 from "d3";
import {useEffect, useRef, useState} from "react";

export default function App() {
  const containerRef = useRef();
  const [data, setData] = useState();

  useEffect(() => {
    d3.csv("/gistemp.csv", d3.autoType).then(setData);
  }, []);

  useEffect(() => {
    if (data === undefined) return;
    const plot = Plot.plot({
      y: {grid: true},
      color: {scheme: "burd"},
      marks: [
        Plot.ruleY([0]),
        Plot.dot(data, {x: "Date", y: "Anomaly", stroke: "Anomaly"})
      ]
    });
    containerRef.current.append(plot);
    return () => plot.remove();
  }, [data]);

  return <div ref={containerRef} />;
}
This example also demonstrates asynchronously loading CSV data with useState. If you want to update your plot, say because your data has changed, simply throw away the old plot using element.remove and then replace it with a new one. That’s done above in the useEffect’s cleanup function.
Plot in Vue
As with React, you can use either server- or client-side rendering with Plot and Vue.
For server-side rendering (SSR), use the document plot option to render to Vue’s virtual DOM. For example, here is a PlotFigure component:
import * as Plot from "@observablehq/plot";
import {h} from "vue";

export default {
  props: {
    options: Object
  },
  render() {
    return Plot.plot({
      ...this.options,
      document: new Document()
    }).toHyperScript();
  }
};
INFO
For brevity, the virtual Document implementation is not shown. You’ll find it linked below.
Then, to use:
<script setup>
import * as Plot from "@observablehq/plot";
import PlotFigure from "./components/PlotFigure.js";
import penguins from "./assets/penguins.json";
</script>

<template>
  <h1>Plot + Vue</h1>
  <PlotFigure
    :options="{
      marks: [
        Plot.dot(penguins, {x: 'culmen_length_mm', y: 'culmen_depth_mm'}),
      ],
    }"
  />
</template>
See our Plot + Vue CodeSandbox for details.
For client-side rendering, use a render function with a mounted lifecycle directive. After the component mounts, render the plot and then insert it into the page.
import * as Plot from "@observablehq/plot";
import {h, withDirectives} from "vue";

export default {
  props: ["options"],
  render() {
    const {options} = this;
    return withDirectives(h("div"), [
      [
        {
          mounted(el) {
            el.append(Plot.plot(options));
          }
        }
      ]
    ]);
  }
};
As with React, to update your plot for whatever reason, simply render a new one and replace the old one. You can find more examples on our GitHub as this documentation site is built with VitePress and uses both client- and server-side rendering for plots!
Plot in Svelte
Here’s an example of client-side rendering in Svelte. For server-side rendering, see #1759.
<script lang="ts">
  import * as Plot from '@observablehq/plot';
  import * as d3 from 'd3';

  let div: HTMLElement | undefined = $state();
  let data = $state(d3.ticks(-2, 2, 200).map(Math.sin));

  function onMousemove(event: MouseEvent) {
    const [x, y] = d3.pointer(event);
    data = data.slice(-200).concat(Math.atan2(x, y));
  }

  $effect(() => {
    div?.firstChild?.remove(); // remove old chart, if any
    div?.append(Plot.lineY(data).plot({ grid: true })); // add the new chart
  });
</script>

<div onmousemove={onMousemove} bind:this={div} role="img"></div>
See our Plot + Svelte REPL for details.
Plot in Node.js
You can use Plot to server-side render SVG or PNG in Node.js. Use JSDOM for a DOM implementation via the document option, then serialize the generated plot using outerHTML.
import {readFile} from "node:fs/promises";
import * as Plot from "@observablehq/plot";
import * as d3 from "d3";
import {JSDOM} from "jsdom";

const penguins = d3.csvParse(await readFile("./penguins.csv", "utf-8"), d3.autoType);

const plot = Plot.plot({
  document: new JSDOM("").window.document,
  marks: [
    Plot.dot(penguins, {x: "culmen_length_mm", y: "culmen_depth_mm", stroke: "species"})
  ]
});

plot.setAttributeNS("http://www.w3.org/2000/xmlns/", "xmlns", "http://www.w3.org/2000/svg");
plot.setAttributeNS("http://www.w3.org/2000/xmlns/", "xmlns:xlink", "http://www.w3.org/1999/xlink");

process.stdout.write(plot.outerHTML);
To rasterize SVG as PNG, you could use canvg and node-canvas, or sharp:
process.stdout.write(await sharp(Buffer.from(plot.outerHTML, "utf-8")).png().toBuffer());For better font rendering, consider Puppeteer.