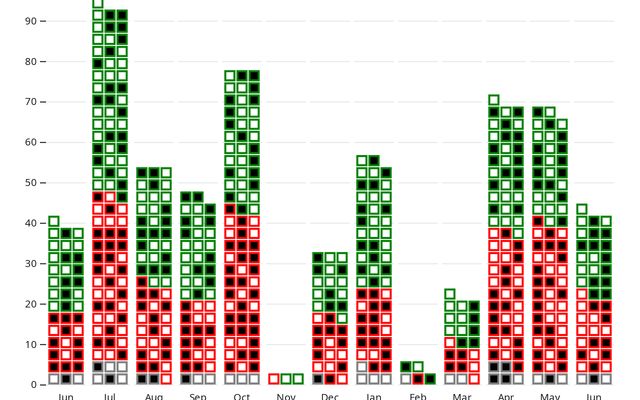
Most stars last month

Jan 24, 2022•43 5


Jun 17, 2022•26 2

Dec 13, 2022•182 9

Oct 8, 2023•53

Apr 24, 2019•209 4

Nov 23, 2020•126 7
Sep 29, 2025•2

Mar 9, 2018•41

Jul 27, 2023•6

Jul 16, 2023•30


Jan 25•12


Jul 6, 2019•54

Sep 1, 2023•28

Oct 25, 2018•54

Jan 19•10

Dec 16, 2022•270 17


Jun 7, 2023•153 1

Jul 17, 2023•117

Aug 31, 2019•30


Mar 9, 2025•11

Dec 14, 2022•67 1

Jul 4, 2023•145 2

Sep 12, 2018•5