Fast, rich, interactive graphics are the stars of data apps built with Observable Framework. Just behind the scenes, however, are a number of essential assistants that get them to the red carpet.
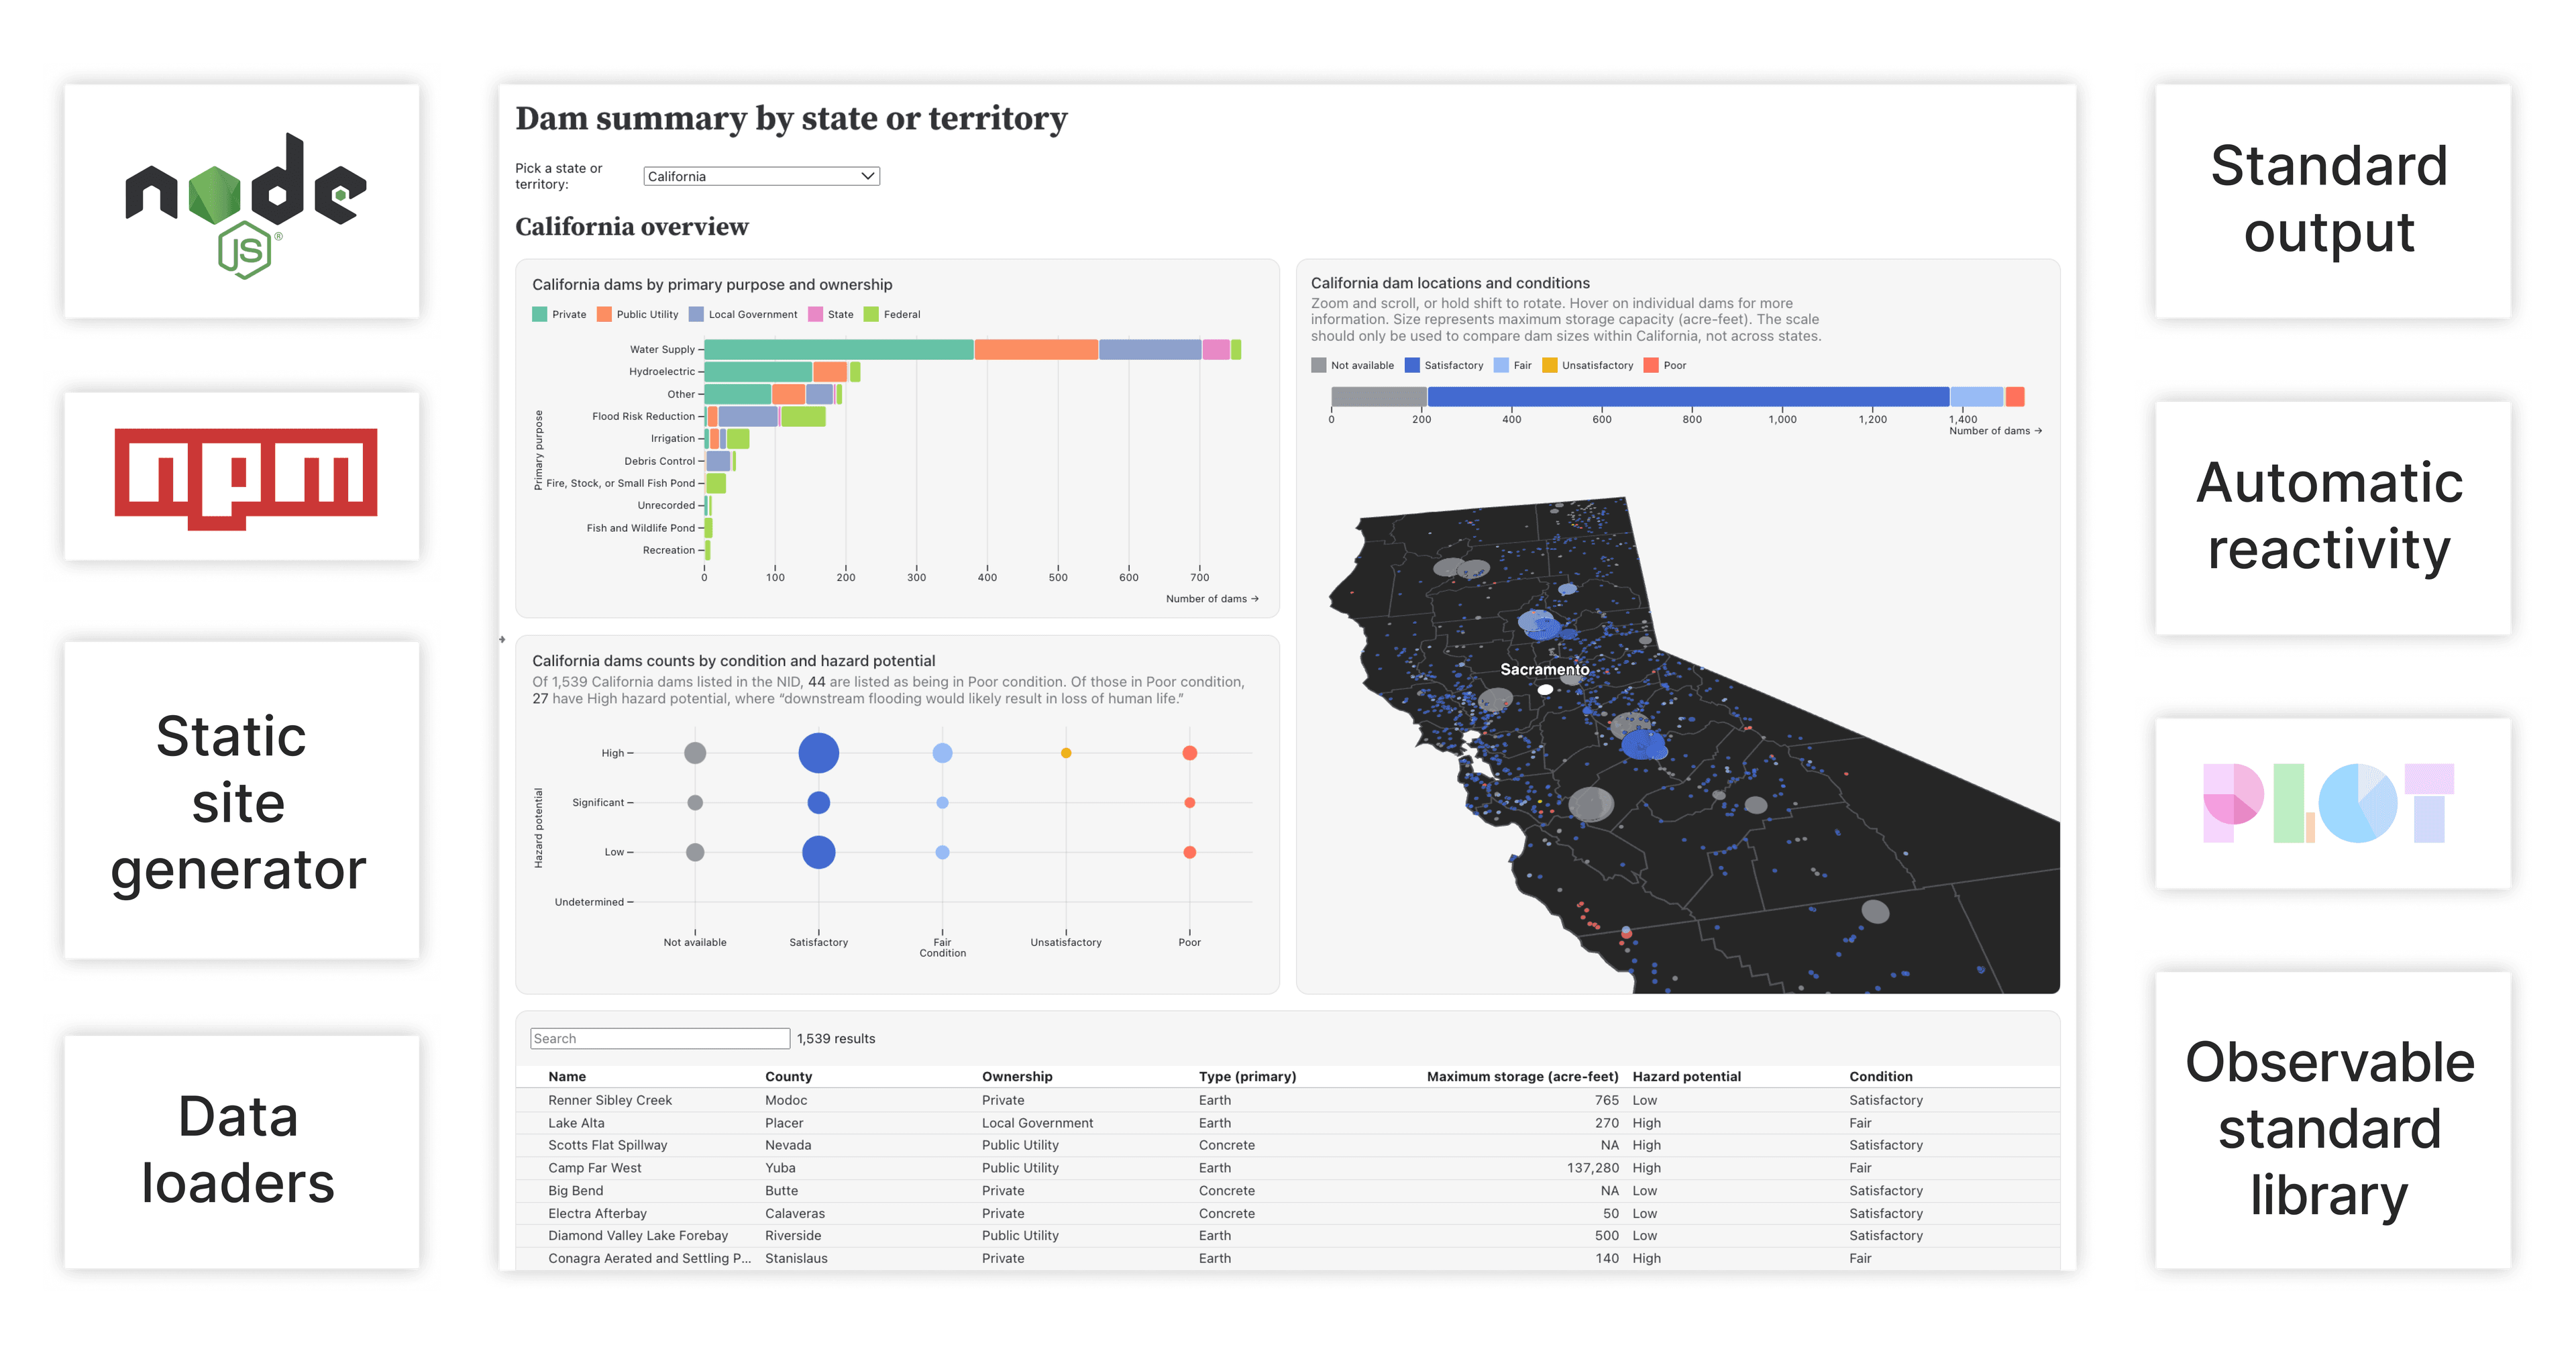
Supporting services, software, and features (like Node.js, npm, data loaders, and the Observable standard library) help to make Framework data apps fast and flexible.
Experienced web developers might already have deep knowledge of some of the supporting software, services, and features (like Node.js, npm, static site architecture, and standard output) that Framework relies on. But for data teams and analysts who don’t spend as much time working in JavaScript, they may be less familiar.
Whether you’re a data scientist building your own data app with Framework, or part of a data team working with JavaScript developers to create data visualizations together, it’s helpful to know the basics of what’s going on behind the curtain.
Here, we introduce eight essential tools that data teams should be familiar with when building data apps with Framework.
Node.js: The JavaScript runtime environment for data apps
To execute JavaScript code — which is the basis of Framework data apps — you need a runtime environment. Browsers already have a built-in JavaScript runtime. But, when you’re working locally and outside of the browser (where you develop Framework data apps), that may not be available by default.
Node.js is a "free, open-source cross-platform JavaScript runtime environment." With Node.js installed you can run JavaScript anywhere, including locally, outside of the browser. To learn how to install Node.js, you can find the official docs here.
Observable Framework — our open-source tool for building custom data apps — is a Node.js application. You can install Framework from npm (see below) to develop, preview, and build your data apps locally. That means that Framework projects integrate nicely with your existing file-based data workflows, and you can develop data apps using your favorite code editor.
npm: Access millions of JavaScript packages
npm is a popular package manager for Node. It is, first and foremost, a software registry — the go-to place from which developers install over 2 million JavaScript packages. Are you familiar with software repositories like PyPI (for Python packages) or CRAN (for R users)? This is the JavaScript equivalent.
Observable Framework is published on npm. To create a new data app and ensure you’re using the latest version of Framework, run:
npx "@observablehq/framework@latest" createnpx allows execution of npm packages without explicitly adding them as a dependency. (Note: Node.js installs both npx and npm utilities by default, so you won’t have to install these manually if you already have access to Node.)
And, npm isn’t just the world’s biggest grocery store for reusable JavaScript software. It’s also a command line interface that helps you execute Framework commands, for example to build and deploy your data app.
Note: You can also install Framework, and execute Framework commands, using yarn. Like npm, yarn is a package manager for JavaScript projects.
Static site generators: Deliver data apps that load instantly
Static site generators (sometimes abbreviated as SSGs) build all the files and code needed for a website or data app. The site is then served from these generated, static files. Data teams might be familiar with static site generators like Jekyll and Hugo, which are commonly used in the data science space for websites, blogs, and static pages. Framework is the equivalent, with a focus on creating best-in-class data apps.
When you build with static site generators, time consuming queries and data processing (e.g. data wrangling and modeling) are executed before the required page contents are packaged up and sent to the user’s browser. That results in faster page loads, and better app performance.
There’s a common misconception that a static site generator can only create non-interactive pages. But, to reference a classic film:
You keep using that word. I do not think it means what you think it means.
Inigo Montoya
In reality, static site generators — like Observable Framework — are key to building faster interactive data apps, since charts don’t require new computation each time a user selects a different radio button or changes a slider value.
When you build with Framework, you can precompute data for all scenarios you want a user to explore (e.g., using a data loader). That means users will still be able to interact with your visuals, and — because your app doesn’t re-run queries or analyses from scratch every time a user changes a selection — the interaction is faster, and reduces loads on shared databases.
Learn more about static site generators and why they’re great for fast, interactive data apps in our recent blog post (also available in video format).
Note: building a static site doesn’t mean you can’t include JavaScript code that accesses data from an API or database, or that performs client-side computations. But, beware that doing so means your viewers will have to wait until those processes are complete for their page to load, which can be slow. Which brings us to data loaders!
Data loaders: Precompute data for fast, interactive data visualizations
Let’s say you want to include a rich, interactive chart in your data app, which visualizes a large number of records that are returned by an involved SQL query. If all data processing happens right when a viewer opens your app on their device, they’ll have to wait for the query to run, and the data to load in their browser, before the chart is rendered.
That can be slow. Slow data apps that make users wait are more likely to rot.
Data loaders are the antidote.
Data loaders are programs that you can write in any language (Python, R, JavaScript, SQL, or anything else) to generate data snapshots at build time. With data loaders, you can do all of your data pre-processing, analysis, and modeling behind the scenes to minimize what gets sent to the client. The result is less data sent to the client, and less computation required when a user opens your data app — and that means faster pages and happier viewers, who are more likely to return.
See the Framework docs, our recent blog post and video, and the ever-expanding collection of data loader examples to learn more about how data loaders work, why they’re awesome, and how to make your own.
And, check out our new page loaders in Framework. Whereas data loaders precompute data snapshots for better performance, page loaders “pre-bake” dynamically generated pages for even faster page loads!
Standard output: Streamlining data integrations for data apps
To work with Framework’s routing, data loaders must send their output to standard output. What is that, and why is it so important when building your data apps?
Standard output is one of the standard streams in Unix and POSIX systems, and is the expected place where programs write data to. What happens when you write a data loader, and where does standard output fit in?
If the file generated by a data loader is referenced in a Markdown page, Framework’s routing will first check to see if the output lives as a static file at the designated path. If it does not, then it will check the cache — that’s where outputs of data loaders are stored — to (1) see if it exists there, and (2) if the timestamp of the cached file is older than that for its parent data loader.
If the data loader has been updated more recently than its last cached output, the data loader is re-run. The data loader output is read from the standard output stream, and (thanks to Framework’s routing) is stored in the cache where it is accessed by the Markdown file.
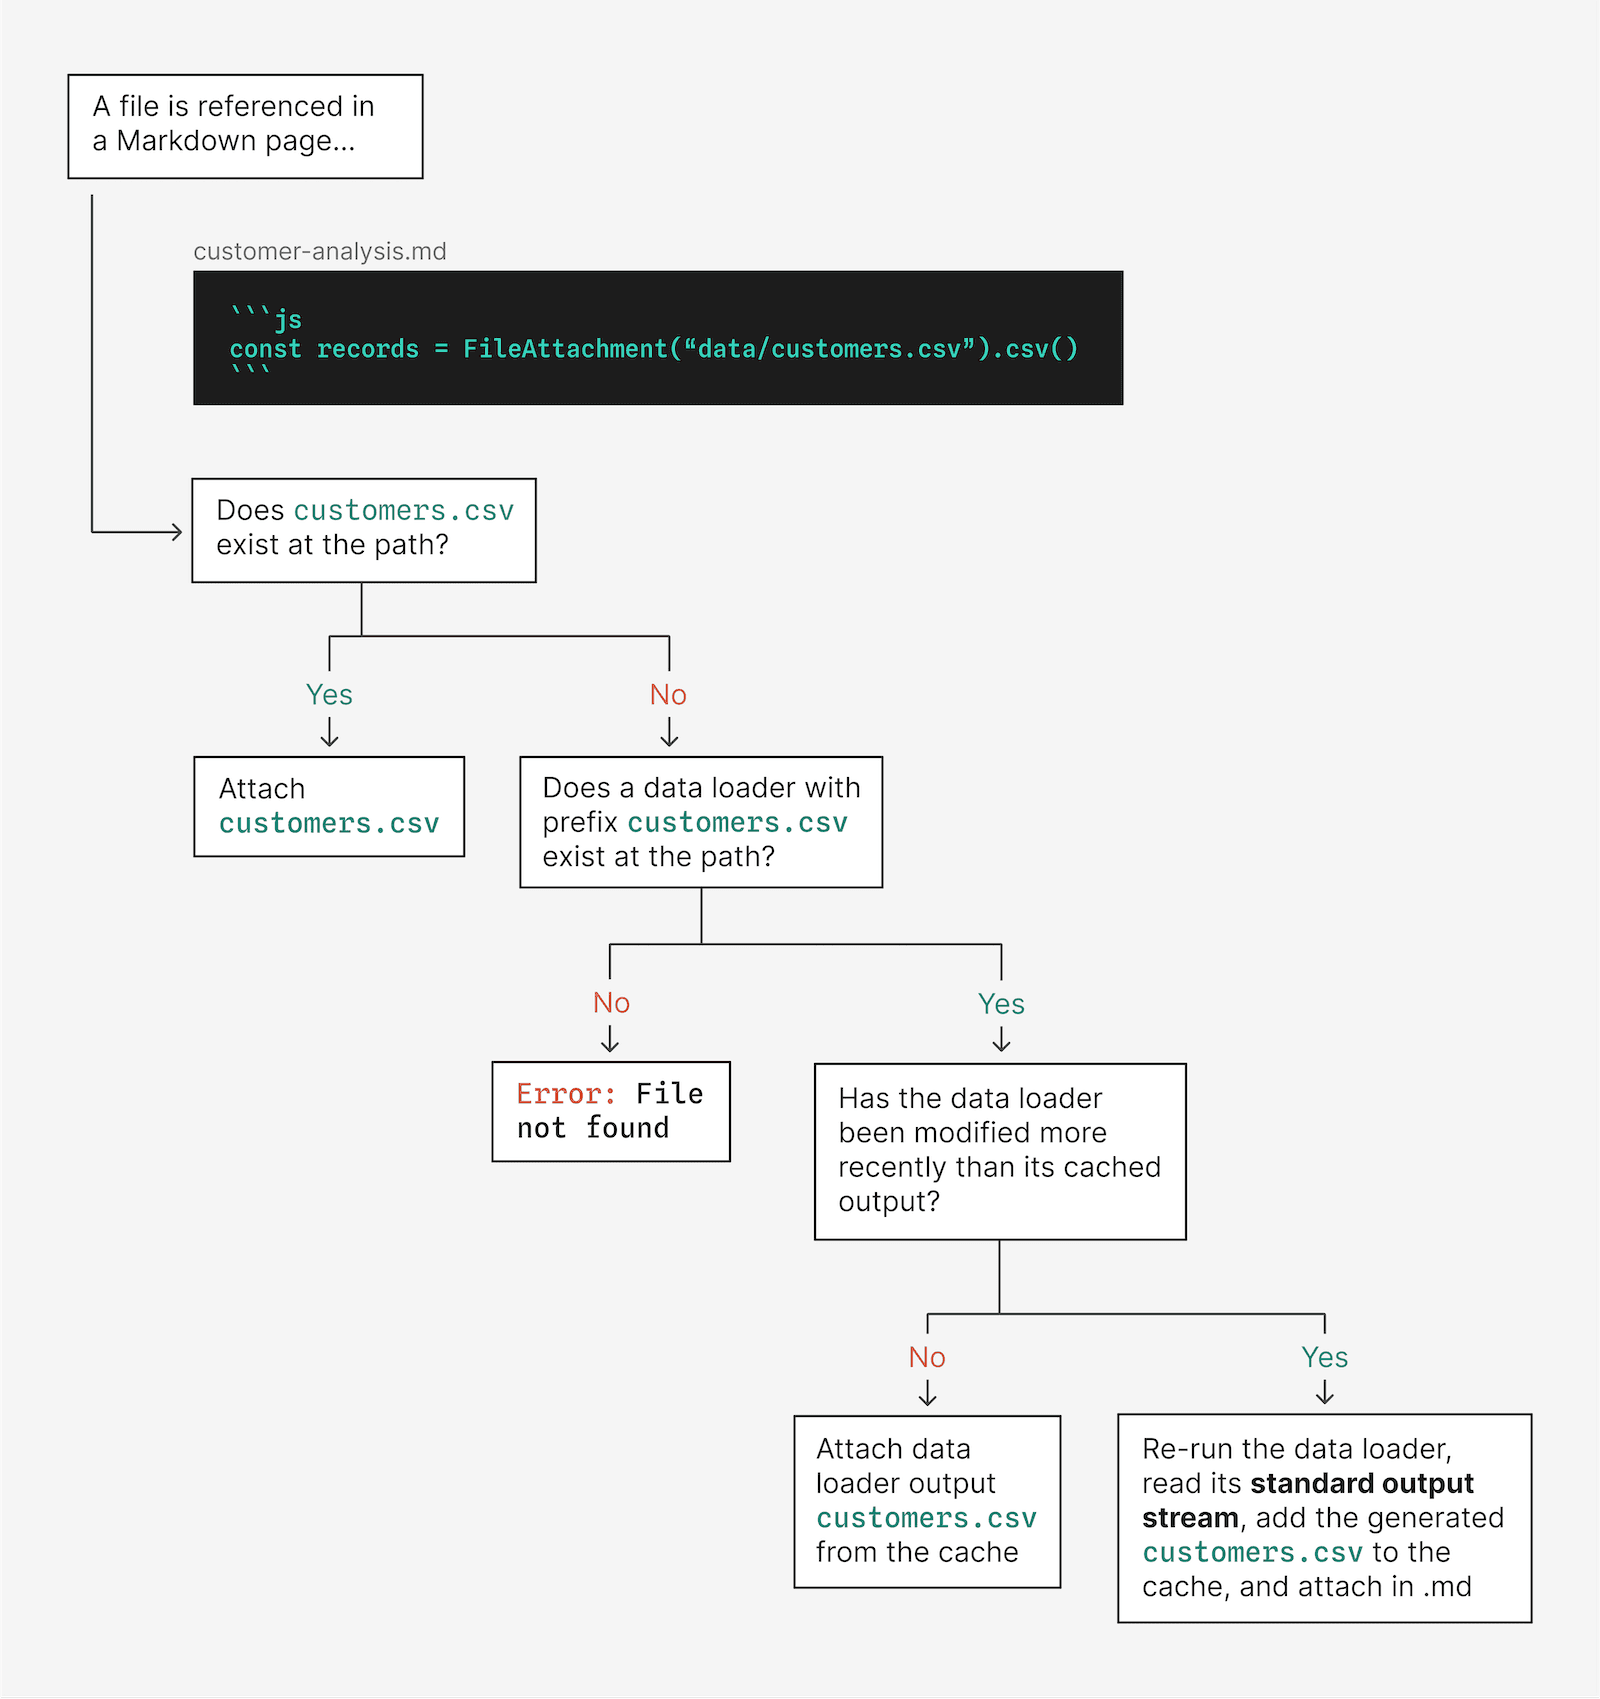
The sequence of steps that determine if a data loader is re-run (and the output sent to standard output) when a file is referenced in a Markdown page using FileAttachment.
Automatic reactivity: Develop data apps more efficiently
If you’ve ever used an Excel spreadsheet where a change to one cell value is propagated instantly to all other cells that depend on it, then you’ve experienced automatic reactivity.
When working in Framework (and Observable Notebooks, for that matter), automatic reactivity is supported in your code. Whenever you update a piece of code, any downstream code that depends on it is automatically re-executed.
This has a number of advantages for your development experience and page performance. For example, you can work more flexibly, since you can organize your code however you want, not just from top to bottom. Since changes propagate throughout all of your code, you don't have to worry about manually re-running pieces to ensure you're seeing correctly updated outcomes. And, because only downstream code is re-executed, pages are more performant (compared to those requiring a full-page reload any time someone clicks on a radio button).
Learn more about how reactivity works, and why it’s so useful, in our Framework documentation.
Observable standard library: Rich and expressive data visualization components
When building data apps with Framework, you can import any JavaScript libraries you want for data analysis and data visualization, including from npm, local paths, and remote URLs. But some libraries are so useful, and so commonly used, that it makes sense to have them available in Framework by default.
Meet the Observable standard library — a collection of JavaScript libraries available out-of-the-box when you build data apps with Framework. That includes powerful libraries for creating interactive data visualizations (like D3, Observable Plot, Leaflet, Mosaic vgplot, deck.gl, and Observable Inputs) and analysis (e.g. DuckDB and Arquero).
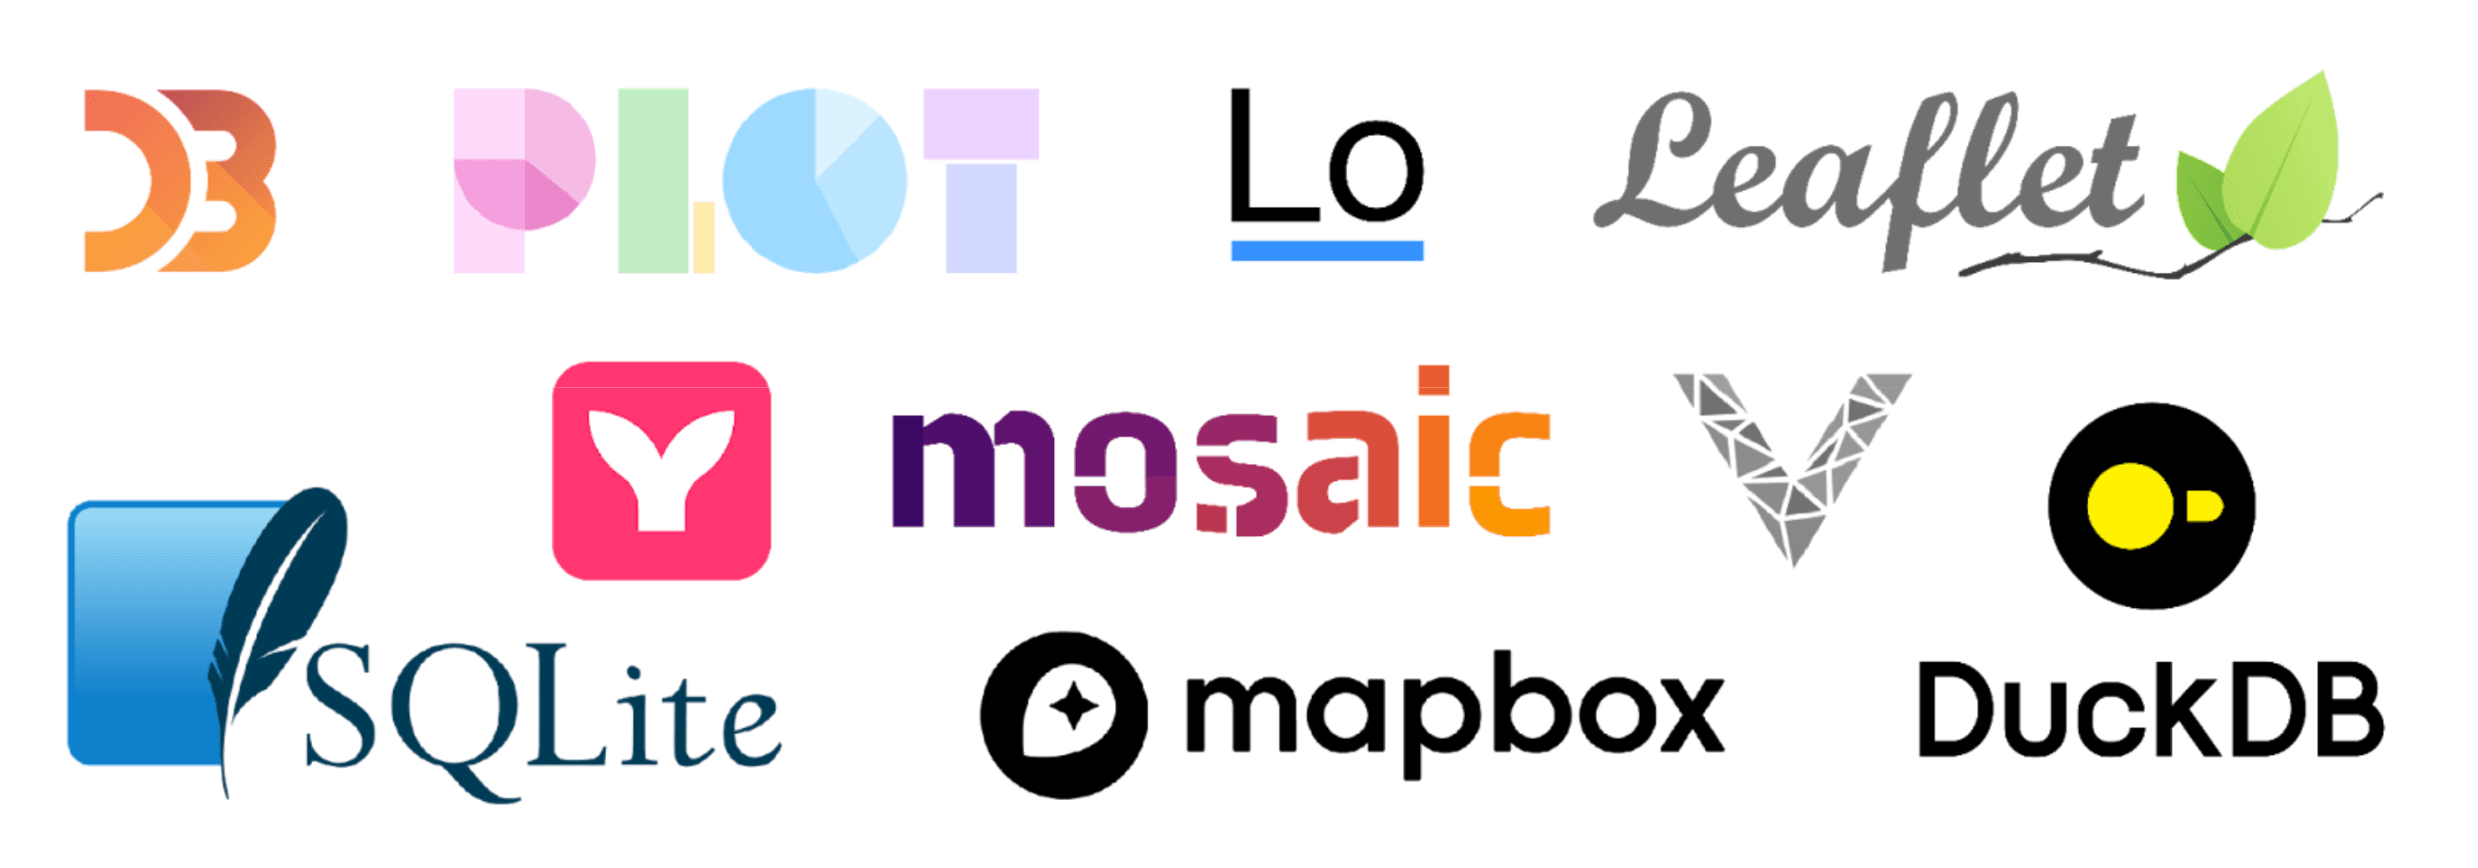
Some of the libraries available in Framework out of the box as part of the Observable standard library.
What does that mean for you? With Node.js and npm installed, you can create a new Framework data app and immediately start building interactive data visualizations.
See the Libraries section of our Framework page to learn what else is at your fingertips, and learn how the Framework standard library differs from that of Observable Notebooks.
Observable Plot: Create interactive data visualizations with concise code
JavaScript is the premier language for building custom, interactive charts and graphics. It’s also not a language that most data teams use for their day-to-day work — that’s more likely to be a language like Python, SQL, or R.
With data loaders on the back end, Framework lets you wrangle and analyze data in any language. But when it comes to creating interactive graphics in Framework data apps, those are built in JavaScript.
There are many JavaScript libraries for data visualization. But the one that we recommend for data teams taking the leap into Observable is Observable Plot. Plot is an open-source library for building exploratory data visualizations layer-by-layer with marks and scales, based on the grammar of graphics.
For data teams already building charts with other grammar of graphics-based tools like ggplot2 (for R users) and plotnine (for Python users), Plot will feel familiar. Initialize a plot, add marks that represent your data, and map variable values to chart elements like mark size, color, opacity, and more to make increasingly expressive graphics. And, because it’s built on D3, you can extend Plot charts with D3-supported animation or any other bespoke customization.
To learn more, read our blog post on building Framework dashboards using Plot.
Conclusion: Start building with Observable Framework today
By understanding the essential tools for working with Observable Framework, analysts and data teams will be better equipped to more efficiently build fast, interactive data apps.
Node.js and npm let you work locally to build with Framework (in files, using your favorite code editor!) while using any JavaScript library you like to build the best data visualizations. Data loaders and our static site architecture let you precompute data snapshots, and pre-package page contents, to give viewers the fastest pages and best user experience. The Observable standard library makes powerful tools for data visualization and analysis available by default, including Observable Plot — our go-to library for quickly exploring data and prototyping new charts.
With some essentials under your belt, you're ready to start building with Framework! Check out our resources to dive in:
Follow along with our Getting started guide to create and deploy your first Framework data app
Check out the Framework documentation
Read our recent blog on how Framework helps you create better dashboards, faster
Learn why data loaders are a win for data teams, app performance, and decision makers
Visit the Observable Plot documentation and gallery