There isn’t one right way to get value from data: the best tool for a data job is the one that helps you, your team, or your viewers to answer their questions — quickly, responsibly, and with confidence.
Some questions require an ephemeral one-off SQL query or exploratory chart. For example, a VP of sales might ask about a single customer’s total page visits over the past 30 days. In that case, an analyst might perform a simple SQL query and spin up a basic line chart. Other questions, however, might require a persistent, polished dashboard intended for users to view frequently and over the long term. Most often, data teams need tools that allow them to do both: initial data exploration, prototyping, and quick tests, with key insights refined and shared in a final report or data app.
Wherever your questions exist along that spectrum, Observable has you covered with Notebooks and Observable Framework.
Notebooks are interactive, editable documents defined by code. They are created and hosted on the Observable platform. In notebooks, you can combine text in Markdown, code (in JavaScript, SQL, or HTML), and outputs (like interactive charts and tables) in one place.
Observable Framework is a static site generator, with projects composed of files and developed locally in your editor of choice to build fast, custom, user-facing data apps and dashboards.
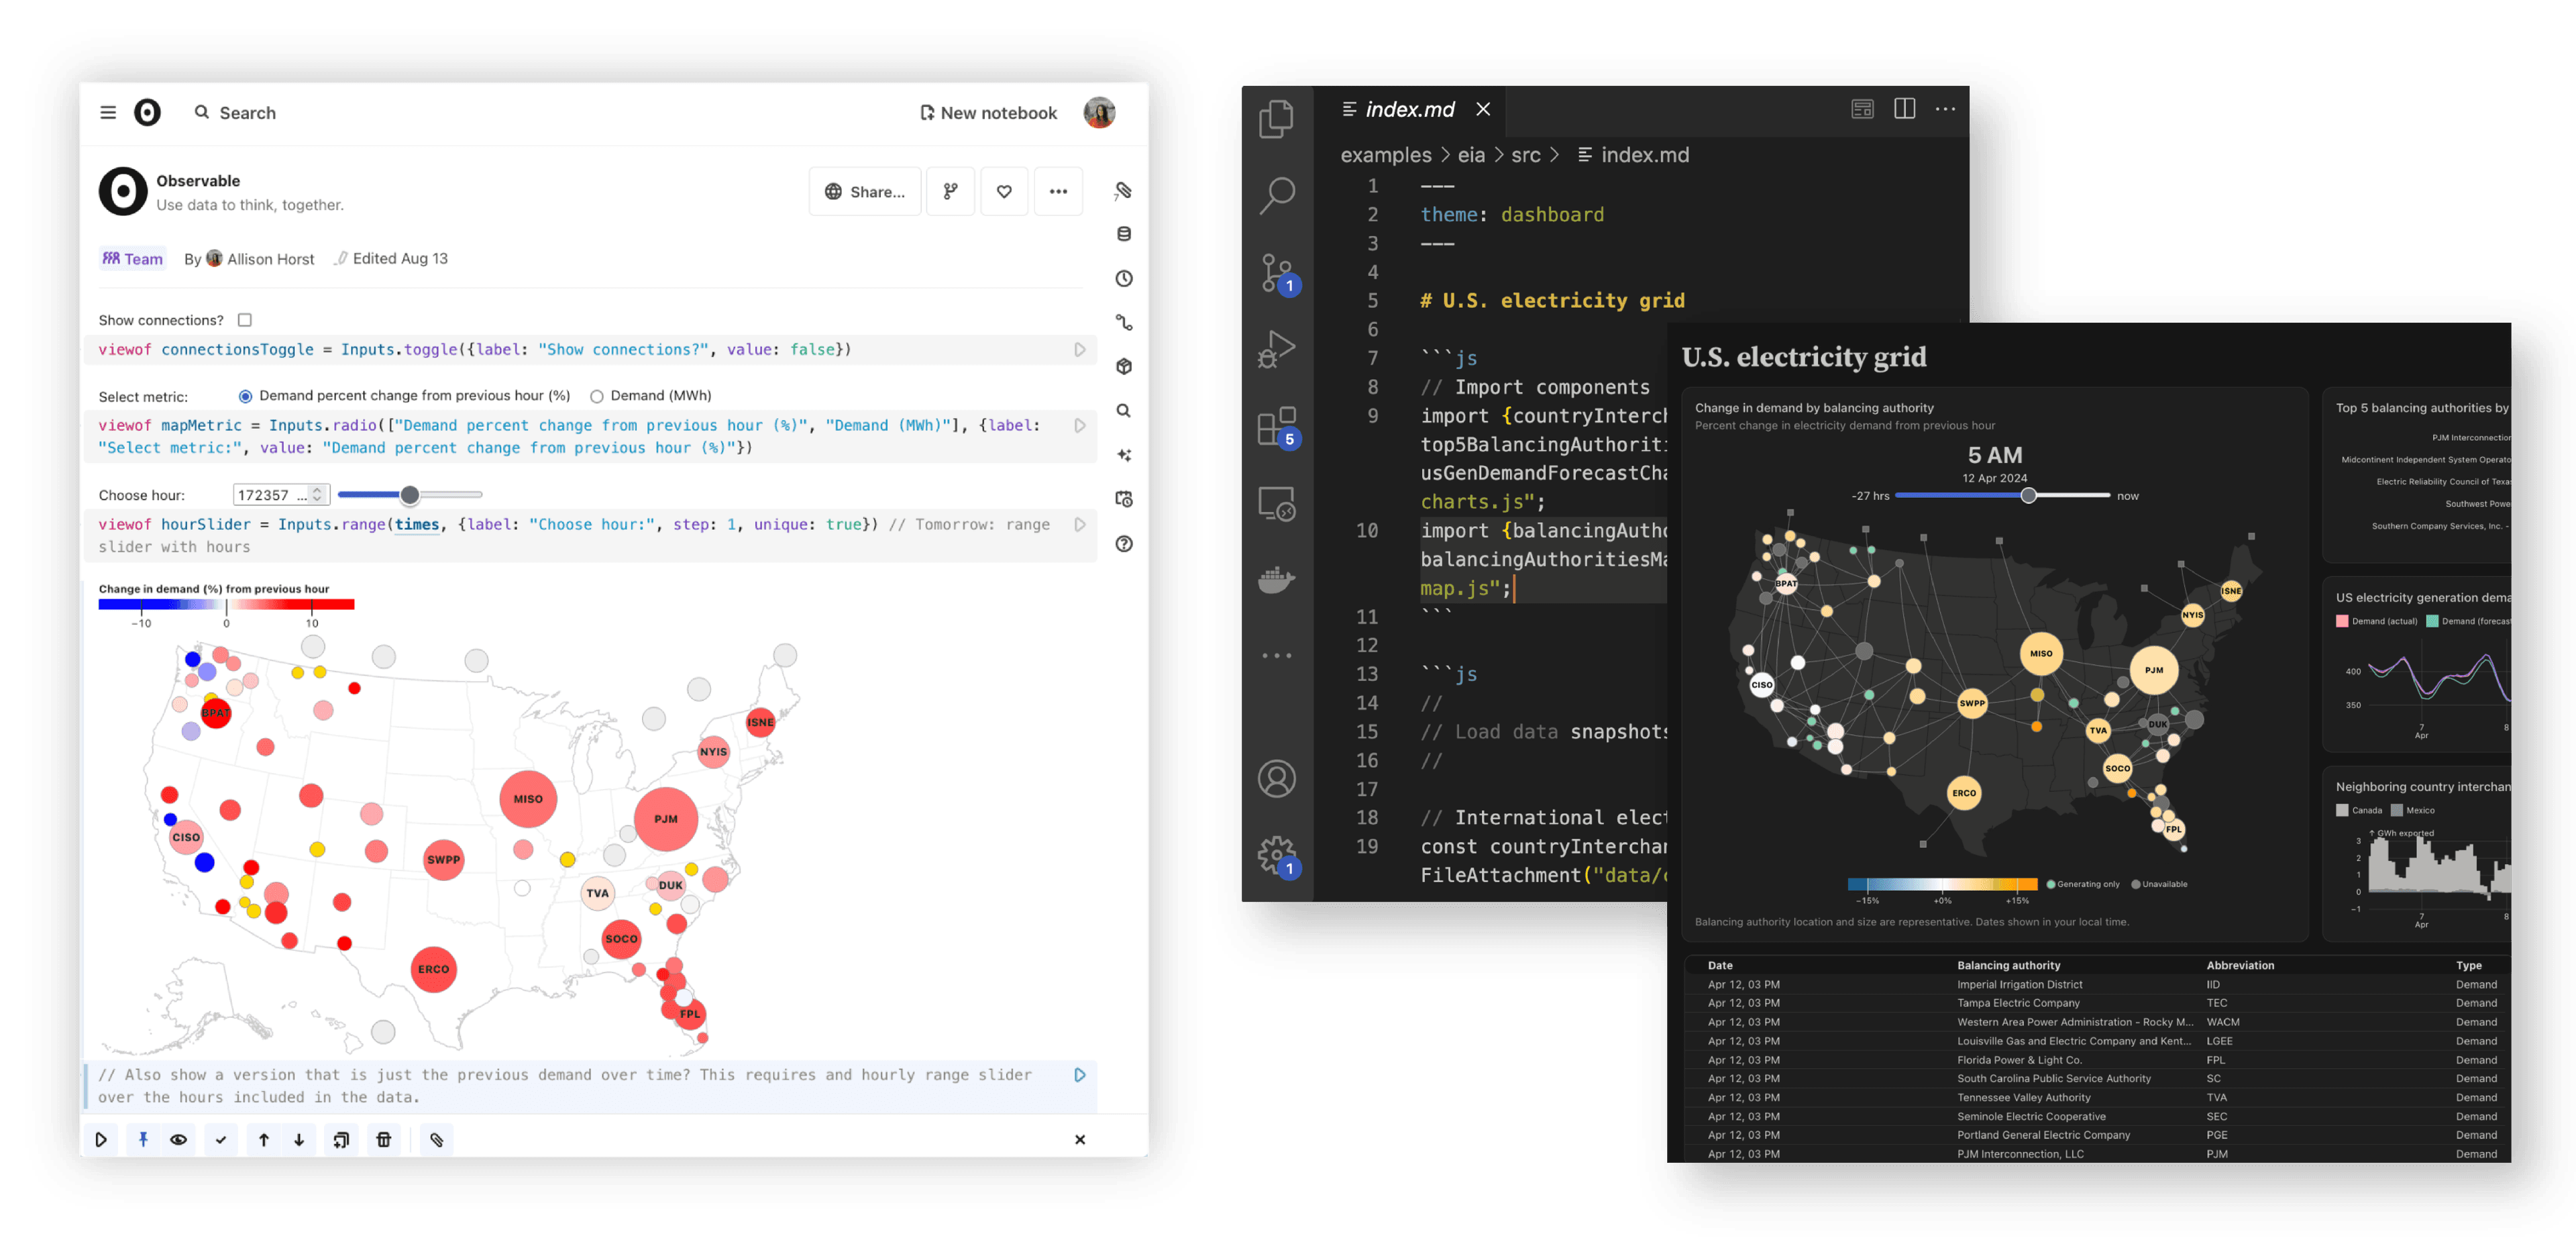
Observable users can work in browser-based Observable Notebooks (left), or build data apps locally with code using Observable Framework (right).
Here, we describe where Observable Notebooks and Framework shine, and how – when used in combination – they accelerate insights from data along the entire spectrum of data work from initial exploration to production-ready data apps.
Using Observable Notebooks for data exploration, collaboration, and ad hoc analysis
Observable Notebooks are designed for data exploration, data analysis, and data visualization prototyping. With Notebooks, you can easily upload data, add Markdown text and code (including JavaScript, SQL, HTML), create interactive data visualizations and other outputs, and share your explorations with your team.
Exploring data and prototyping data visualizations with Observable Notebooks
Observable Notebooks are ideal for data exploration, tinkering, and prototyping graphics.
Notebooks live entirely in the browser, with common JavaScript libraries for data exploration and data visualization (like Observable Plot and D3) available out-of-the-box as part of our standard library, so there’s no installation required to get started.
Connecting to data in databases, local or cloud files, and APIs is fast and painless with existing database connectors and a friendly user interface to attach local or cloud files, or access data from APIs. With your data connected to a notebook, instantly see the contents and summary distributions with the Data table cell or, for database tables, the SQL cell.
After taking a quick look at the data in table format, make exploratory charts in minutes with Observable Plot (our open-source library for exploratory data visualization). Choose from our selection of code snippets for common chart types, then substitute the placeholder data with your own. You can use other libraries in our standard library for data visualization, or choose from thousands of open-source JavaScript modules to use in notebooks with require.
Use notebooks to prototype charts that eventually become part of final data apps. Continue building out exploratory charts and adding interactivity with Observable Inputs. Or, don’t start from scratch! Get inspired by thousands of stunning visuals that live in public notebooks created by Observable community members, fork to make your own copy, then drop in your own data and start fine-tuning.
Just because notebooks are best suited for prototyping doesn't mean that it is impossible to do so in Framework. When building with Framework, the local development server lets you see live changes as you edit. And, Framework (like notebooks) supports automatic reactivity, which means your code automatically re-runs whenever variables change so you're always seeing the latest version of all page content as you iterate.
In fact, in some cases Framework can even be better for prototyping charts. For example, if your chart depends on slow database queries, iterating on visuals can be bogged down by time-consuming client-side processing in notebooks. But with Framework’s data loaders (which we return to below), you can generate a minimal data snapshot that lets you iterate more quickly, and without pre-aggregation. Check out our recent webinar with Mike Bostock to learn how this helped us go beyond summary statistics to more deeply explore and develop rich visuals for our internal web logs.
Collaborating on data visualization prototypes with Observable Notebooks
Notebooks are the best place for teams to collaborate while exploring and developing data displays together. Features made for collaboration (like fine-grained access control and sharing, multiplayer editing, and in-notebook comments) make notebooks a fast — even delightful — place for teammates and stakeholders to work together while keeping everyone’s code, eyes, and ideas literally on the same page.
Of course, you can collaborate in Framework projects using more traditional channels and tools (e.g. sharing, reviewing, and merging work using development platforms like GitHub that support project management and collaboration). And, we’ve started live coding together when building in Framework using VS Code’s Live Share extension. But when it comes to nimble collaboration during exploratory data analysis and visualization, we often look to notebooks first.
Conducting ad hoc analysis, computations, and queries with Observable Notebooks
Some questions just need quick, ad hoc analysis, computations, queries, or exploratory data visualizations. Despite their shorter lifespan and smaller viewership, those fast, on-the-fly data analyses are critical to incrementally adjust business understanding and expectations – and they are another place where notebooks shine. For example, when you securely connect a workspace to a database using our database connectors, all members of the workspace with edit access can immediately start writing queries to answer questions and test hypotheses as they arise.
We often use notebooks for exploratory data analysis and ad hoc queries internally, as described by Observable's Ananya Roy:
Having our internal databases connected to notebooks has meant that there is no barrier to answering questions with real data. This is very empowering. Whether we have a problem to investigate, a new metric to explore, or simply a curiosity to satisfy, it only takes a few seconds to open a notebook and start querying.

Ananya Roy
Keep in mind that when working in notebooks, all your code runs in the browser – which means content can load slowly if it depends on time-consuming queries or data analyses. And, it can be challenging to fully customize display layouts and styling in notebooks. Read on to learn how Framework solves for data app performance and presentation.
Building fast, custom data apps that fit into your developer workflow with Observable Framework
Notebooks are great for exploration and prototyping, but as founder and CEO Mike Bostock recently wrote: ”a notebook can’t compete with a custom web app in terms of user experience.” We look to Observable Framework when we need to make performant, finalized, custom data apps and dashboards that provide viewers with clear insights and the best user experience.
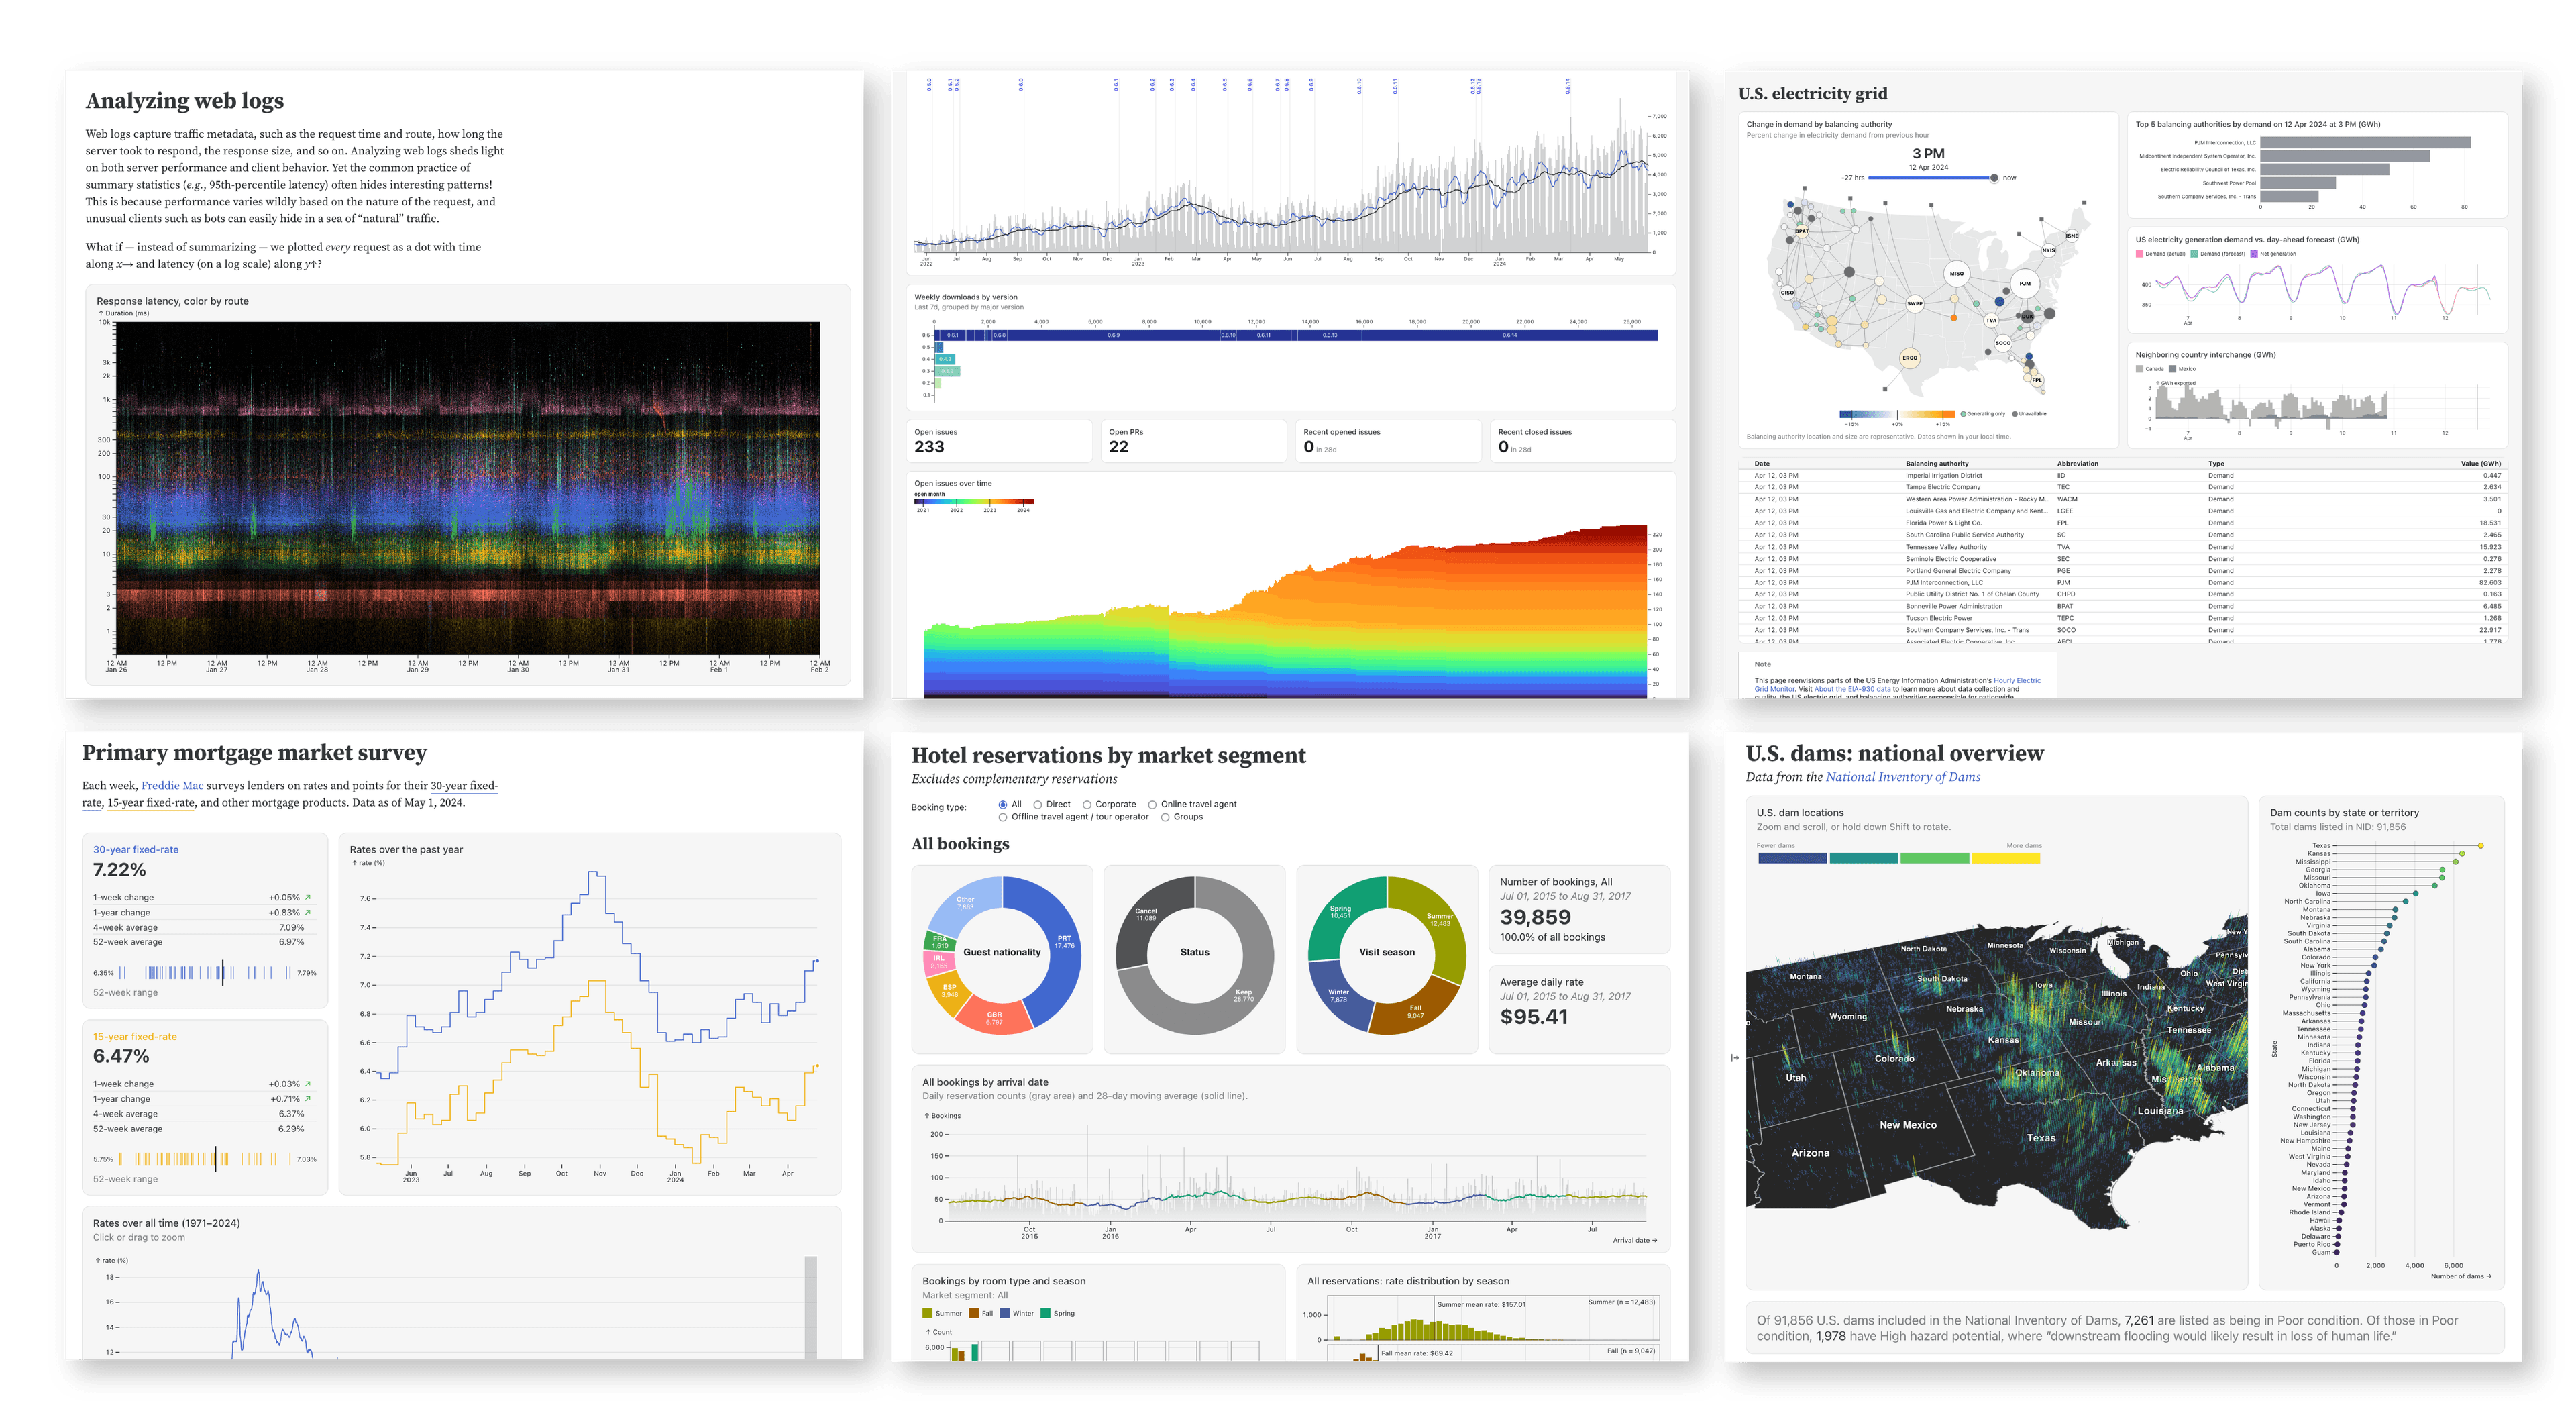
A selection of data apps and dashboards built with Observable Framework.
Using Observable Framework for flexible developer workflows, speed, and polyglot support
Observable Notebooks live on observablehq.com. Notebooks aren’t islands; you can require JavaScript modules and import notebook content, or embed notebook content elsewhere. But a notebook is a web page, not a file, so can’t be easily integrated into file-based workflows. For example, notebooks can’t be tracked using git for version control, or bundled along with other files that are deployed together as pages in a website.
Framework projects, on the other hand, are composed of local files (with defined structure and clever routing), so they can slide right into your team’s existing file-based workflow. And, since it’s just files, you can build in whatever code editor you choose.
Now, let’s talk languages. It’s difficult to integrate languages that teams most often use for data wrangling and analysis, like Python and R, with web-based Observable notebooks. Despite recent WebAssembly (WASM) developments that make it possible to execute code in other languages directly in the browser (e.g. WebR and pyodide), it’s far from simple. As Jeffrey Perkel recently wrote regarding WASM for scientific computing: “brace yourself for complications.”
Framework’s solution to the polyglot problem is data loaders. Data loaders are programs that generate static data snapshots at build time. They can be written in any language — Py, R, Rust, Go, Ruby, SQL, or whatever else — to access, wrangle, and analyze data. Because heavy data processing and minimization is done at build time (instead of when a user opens a page), that means faster data apps and happier viewers. Learn more about the benefits of data loaders in our recent blog post and explore our reusable data loader examples.
In summary: local, file-based Framework projects can more easily integrate with your existing data and developer workflows, let you work in your preferred editor, and support data loaders written in any programming language. If you’re looking for a flexible way to build that plays nicely with your current toolkit to produce fast and custom apps, Framework is a good way to go.
Build the best custom, production-ready data apps and expressive visualizations with code
When you build with Framework, you can easily arrange charts, tables, and text in denser displays typical of dashboards using the built-in grid and card classes.
Quickly update the overall look of one or all pages using our dark and light mode themes, which will automatically respond to your viewers’ device settings. Or, create your own custom stylesheet using CSS to bring your organization’s branding to a project.
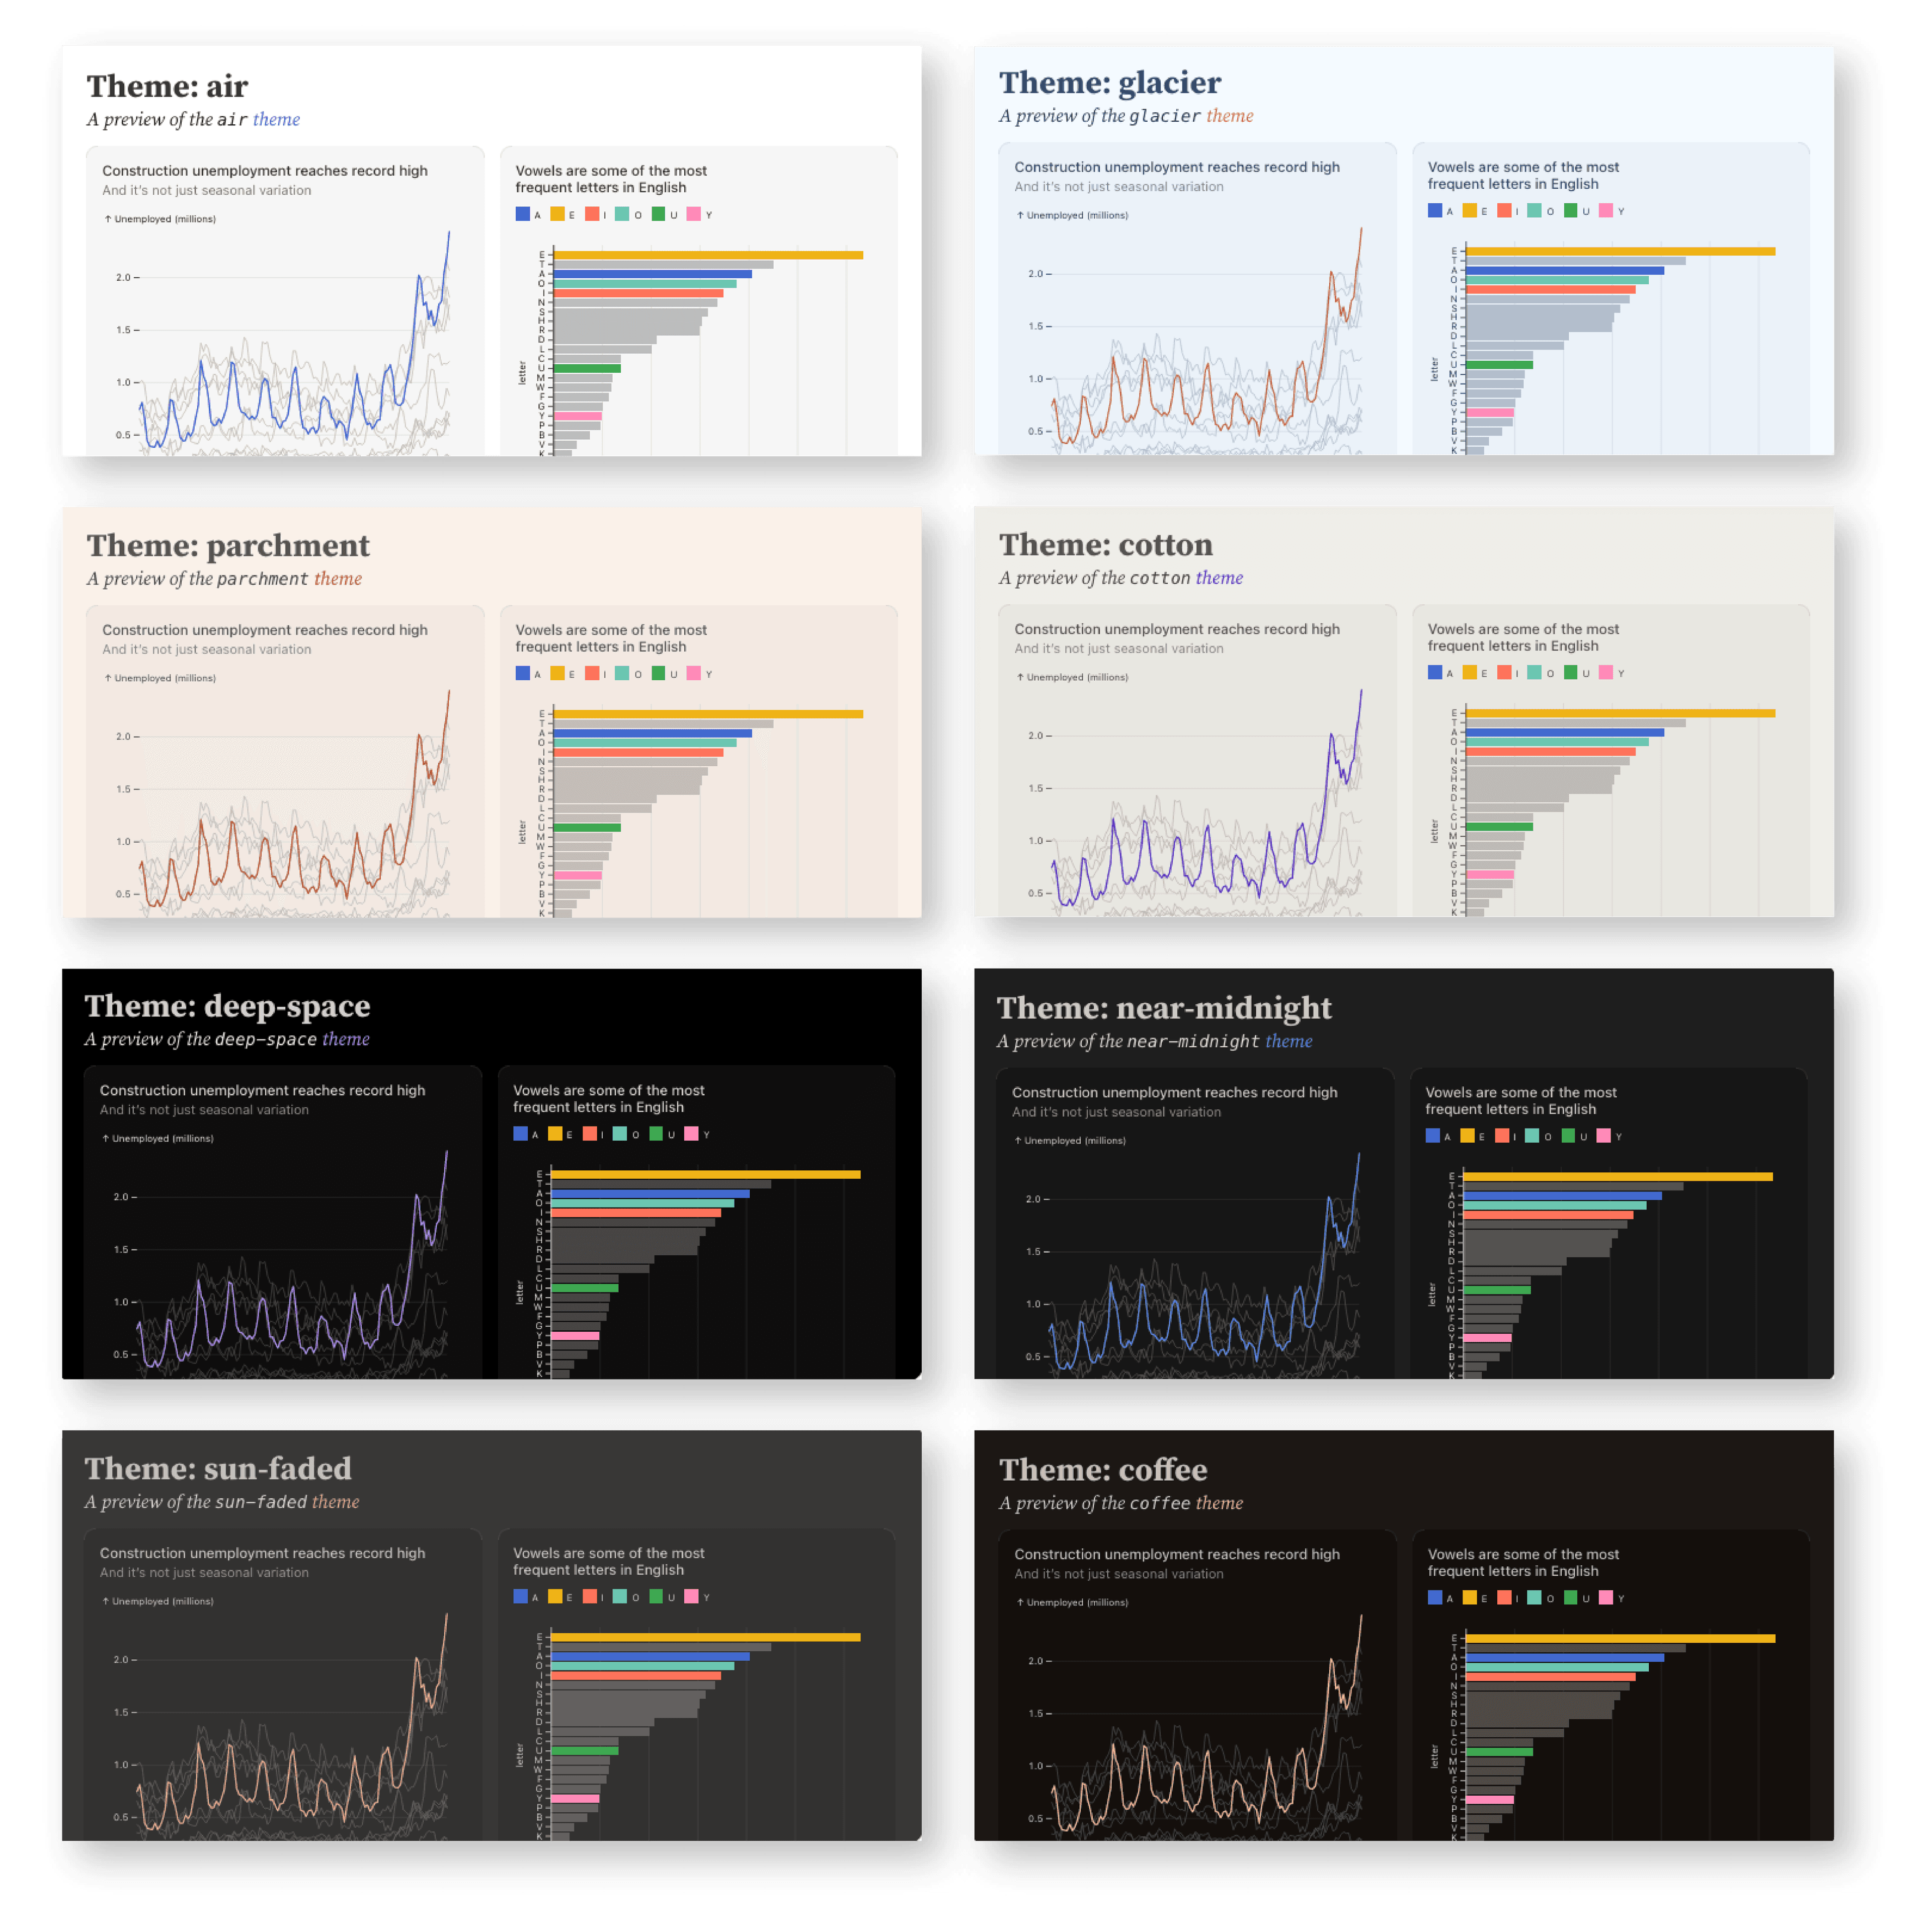
A selection of Framework's built-in dark and light mode themes.
Use Framework’s configuration options to add custom headers and footers, control the table of contents, show or hide the sidebar by default, and more.
Like in notebooks, you can create bespoke, interactive visuals in Framework using libraries like D3, Observable Plot, Mosaic vgplot, deckgl, and others that exist out-of-the-box as part of our standard library. Or, import any other JavaScript libraries from npm, node, or import local or remote modules to use your preferred tools.
So if you need to create custom, polished data apps that provide viewers with a better final presentation and user experience than what’s easily possible with notebooks, we recommend building with Framework.
The best option? Use both: Notebooks for collaboration, and Framework for building finished data apps
Many data projects can benefit from working in both Observable Notebooks and Framework. We often do our exploratory data exploration, visualization, analysis, and prototyping together in notebooks, where our team can build and prototype more nimbly. Once we’ve built out our first chart drafts, we transfer the code into a Framework project for fine-tuning and iteration, custom layouts, performance optimization, and deployment as a final data app.
Currently, we either transfer notebook prototypes to Framework files with a simple copy and paste, or, for public notebooks, using Framework’s built-in convert command (beta).
Within an existing Framework project, you can use the convert command as shown below to convert the Scatterplot notebook from the Plot gallery:
npm run observable convert 'https://observablehq.com/@observablehq/plot-scatterplot/2'Or, if you're using yarn:
yarn observable convert 'https://observablehq.com/@observablehq/plot-scatterplot/2'The convert command helps you convert content from one or more notebooks to standard Markdown for use in Framework projects. While this doesn’t completely eliminate the need for manual tweaks (for example to convert from Observable JavaScript used in notebooks to Framework-supported vanilla JavaScript, or to port over imports from Observable Notebooks, which is currently not supported), it does get you most of the way. Visit the convert command documentation to learn about other caveats, options, and tips for adapting your notebook code for Framework data apps.
We’re excited to improve how users can work between Observable Notebooks and Framework. For example, we’ll eventually port vanilla JavaScript into notebooks, and will extend the convert command to work with private notebooks.
Get started with building data visualizations on Observable
Whether you’re working in Observable Notebooks for collaborative data exploration and exploratory data analysis, in Framework to build faster custom data apps, or both, we have resources to help you get started:
Notebooks and platform features documentation
Join us on our Observable Community Slack and Forum to ask questions, share progress, and stay up-to-date on events, product releases and new resources