2025 was an exciting and transformative year for Observable. As we head into the new year, here’s a look back at the products we launched, the events we hosted, the community creations that inspired us, and what we’re excited for in 2026.
What we launched
Observable Canvases
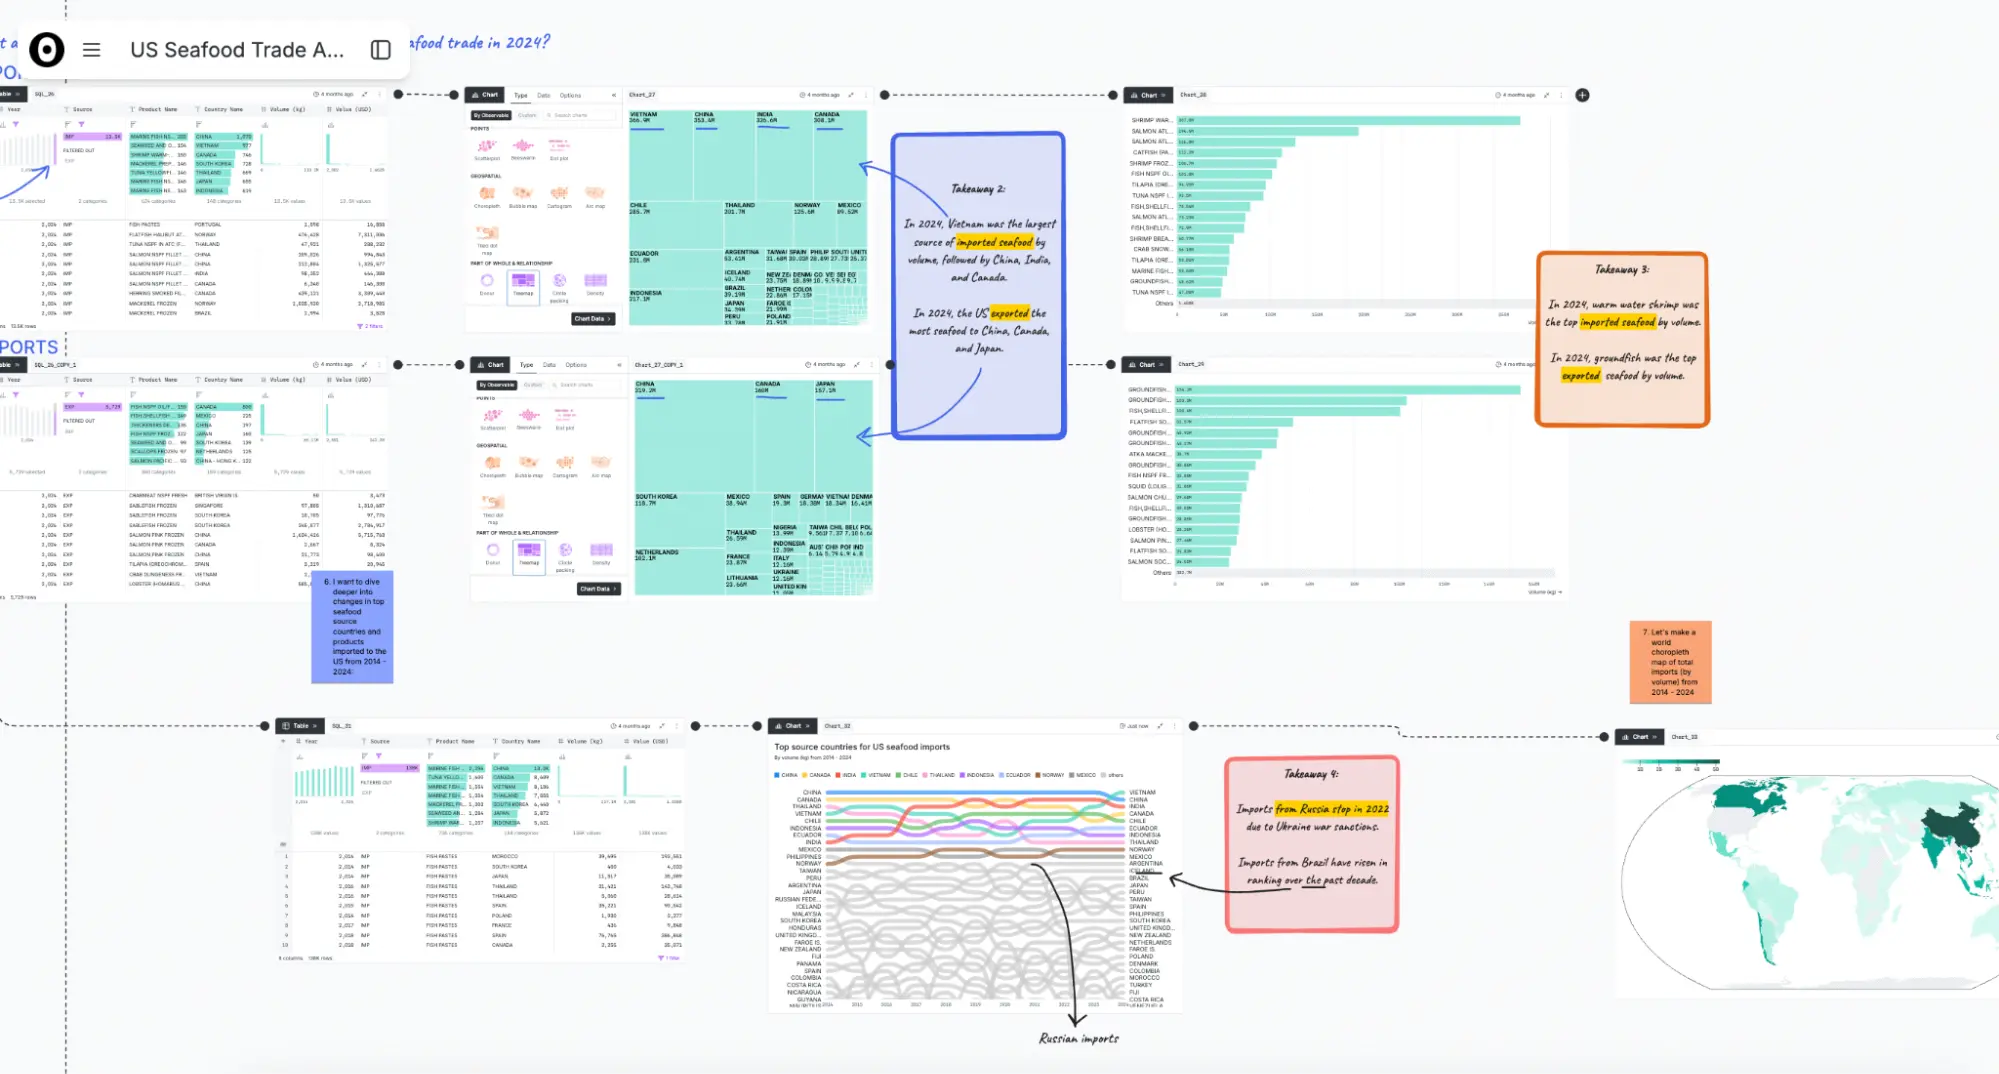
After a busy spring spent building behind the scenes, we were thrilled to announce early access to Observable Canvases in mid-April. Observable Canvases are browser-based collaborative whiteboards for data exploration and analysis. In canvases, analysts can work flexibly between SQL, UI, and AI to transform and analyze data across the infinite canvas, then select from our state-of-the-art chart library to get from raw data to fast, interactive visualizations in minutes.
Learn more about Observable Canvases.
Since our April launch, we’ve been adding more advanced charts to the library, improving performance, developing a new approach to dashboarding right from a canvas, and acting on feedback from early testers.
Expect big news and exciting releases around Observable Canvases in 2026!
Verifiable AI
AI can take some of the tedious grunt work out of data exploration, offering a faster way to profile and wrangle data, prototype charts, and kickstart new analyses. But the risks of AI in data analysis are real: in many tools, AI works in a black box that makes it difficult for users to realize when AI makes an error or does something unexpected with your data.
In July, we announced integrated, transparent, and verifiable AI that speeds up your data work in Observable Canvases, while keeping you in the driver’s seat. Read Mike Bostock’s AI launch post to learn about our human-centric AI principles and how we’re thoughtfully building AI for data analysis.
Notebooks 2.0 and Notebook Kit
The long-awaited next generation of Observable Notebooks — local, file-based, and supporting vanilla JavaScript — landed this summer!
We simultaneously released:
Notebook Kit: An open file format for notebooks, and accompanying open-source tooling for generating static sites.
Notebook Desktop: A macOS desktop application for editing notebooks as local files.
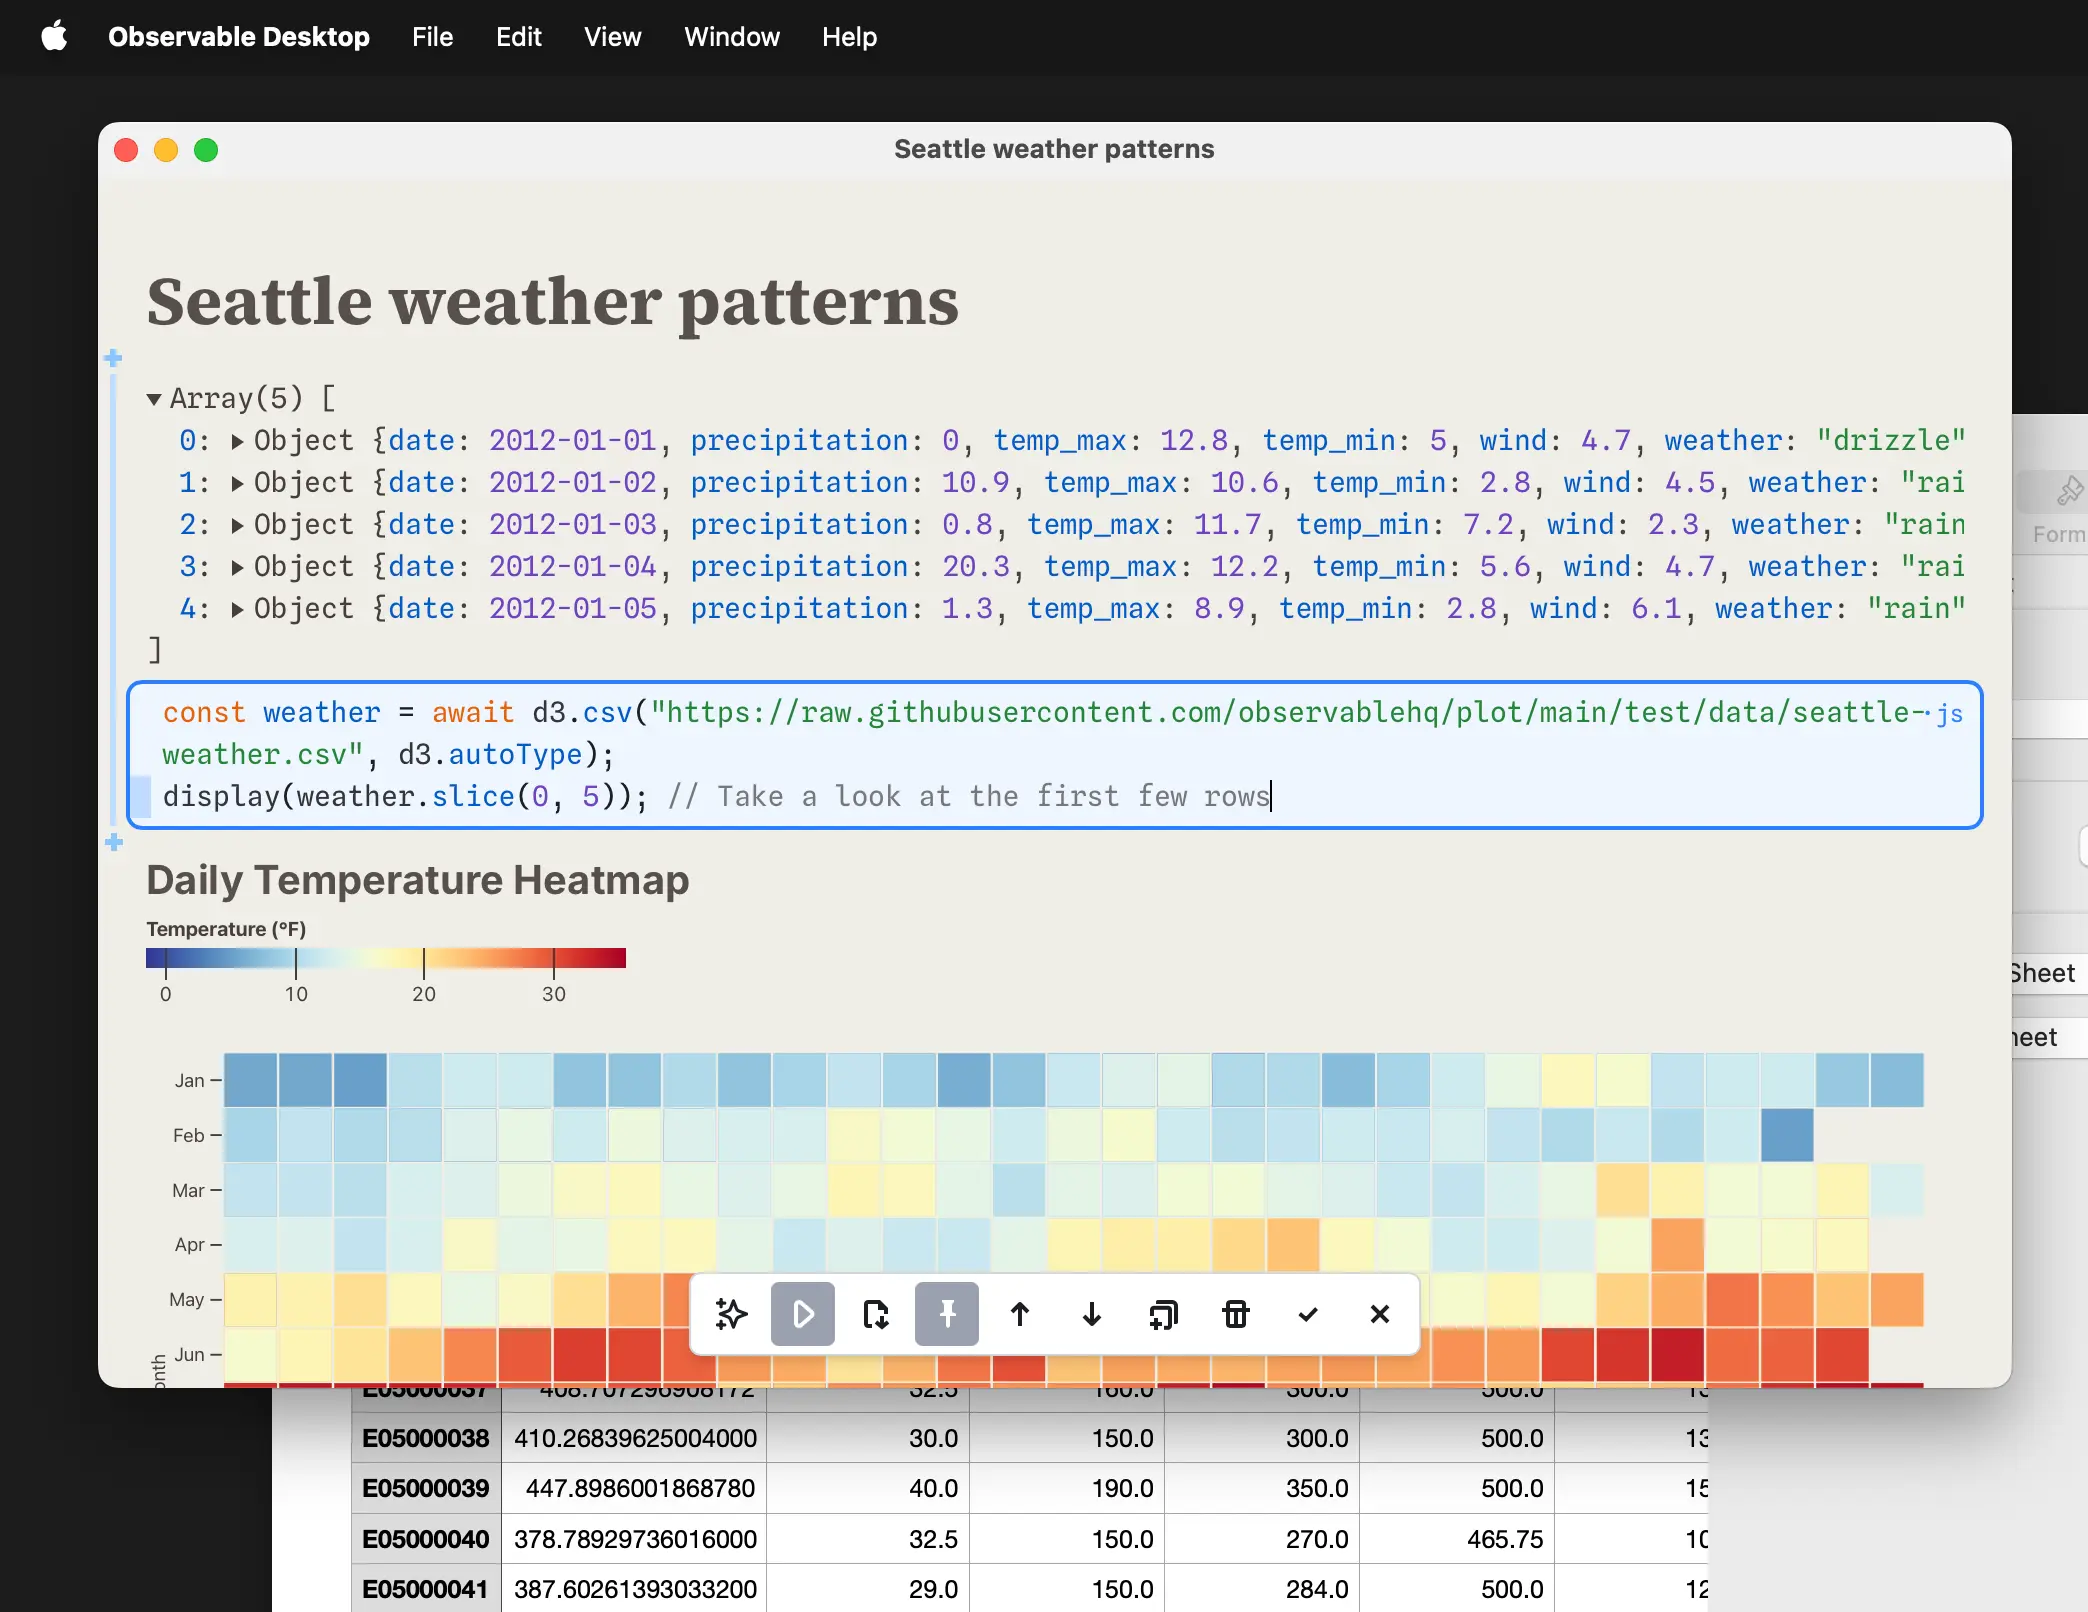
Build locally, code in vanilla JS, and commit files to git with Notebooks 2.0.
Haven’t tried Notebooks 2.0? Check out the documentation to learn more and get started!
Events we led
We hosted a number of events this year, from product-focused webinars led by the Observable team, to inspiring panel discussions featuring top data visualization developers and data journalists. Did you miss any of our events as 2025 went flying by? No problem! You can watch the recordings any time:
📣 Observable Canvases, a first look: Shortly after our April announcement, we hosted our first public demo of Observable Canvases! Canvases have evolved substantially since, but the core workflow for fluid, branching data exploration and fast interactive charts remains.
✨ What’s new in Observable Canvases: Product experts and engineers from the Observable Team shared new canvas features like advanced charts, extended sharing options, more database connectors, and improved workspace management settings.
🎨 Art & Science: Blending analysis and creativity in data visualization: An inspiring and personal discussion about balancing creativity and analytical rigor in data visualization, featuring Kelsey Nanan, Tanya Shapiro, and Shirley Wu.
📰 Storytelling with graphics — from raw data to reader impact: A chat with data journalists Kavya Beheraj (Axios), Ben Welsh (Reuters), and Jared Whalen (The Pudding) on crafting stories from messy data, asking the right questions, and the need for empathy and creativity in news graphics.
Community creations we loved
This year, as always, we were inspired by the creativity and ingenuity of the Observable Community. From novel notebooks to impactful data apps, we loved seeing what you all made with Observable.
A look at the top notebooks from 2025 reveals a mix of creative flare, interactive educational resources, and beautiful maps. Here are a few of the most popular notebooks shared this year:
🧑🎨 Hello custom marks with Plot by Jo Wood: Follow along with this exceptional walk-through to create custom marks for use in Observable Plot charts. Jo also shared a popular Making Plot Sketchy notebook that adds a hand-sketched look to Observable Plot charts!
🗺️ Bivariate maps with Plot by Joe Davies: Explore the relationship between temperature and precipitation for different geographic extents in these eye-catching maps, made with Observable Plot.
🍿 Kernel Density Estimation (KDE) by Pierre Le Bras: Stats teachers, take note! This educational, interactive notebook introduces KDE, and lets viewers explore the impact of different Kernel functions, bandwidths, and more.
🏢 Norwood, Bronx – VTX by Vivi Li, Tristan Guan, and Xenia Villaver: A stunning, interactive city map to explore “the potential for vertical extensions in Norwood in the Bronx as a strategy to help alleviate the need for housing in New York City.”
We also highlighted the work of five Observable creators on our blog. Check out our Creator Features to learn how they’re building charts and data apps that help users answer hard questions, discover new ones, and engage with complex data:
🏘️ From Urban Science to data storytelling: Inside the work of Kelsey Nanan
🌍 We can always talk about maps with Observable Data Visualization Engineer Fil Riviére
🌱 Mapping the future of agriculture with AgroPatterns with Gabriel Koch
🔎 Making science visible: Dr. Philip Bogden on bringing data visualization to cancer research
📈 The anatomy of an impactful data visualization with Karim Douieb
What we're excited for in 2026
Looking ahead, we have big plans for the new year. Here are some things we’re excited about, straight from the mouths of Observable team members:
We've got an exciting lineup of webinars and feature announcements taking shape in early 2026, so stay tuned for event updates! And, we'll be shipping a wave of new educational resources to help folks get up and running in Observable Canvases. We're as inspired as ever by the Observable Community, so you can look forward to more community highlights and Creator Features in the new year.

Hanna Woodburn
We're working on exciting advances in Observable Canvas’ charting capabilities, bringing in some of your favorite charts from the D3 and Plot galleries, plus adding more options, controls, and details to our existing charts. We've overhauled our process to speed up chart development, making it easier to build and test new charts so we can deliver more than ever. 2025 was just the beginning of on-demand charts in canvases — 2026 is about taking it to the next level!

Paul Buffa
I’m looking forward to spending more time learning from our users and understanding their core problems and where our product can better support them. We want to incorporate those insights into design improvements that strengthen the overall user experience. I'm looking forward to continuing to build a product that addresses core user needs and makes people excited to explore and share data insights with their teams.

Marisa Morby
We’ll continue to improve performance and stability so that users get a consistent, delightful experience across canvases, notebooks, charts, and dashboards. I'm looking forward to having a solid foundation for the chart library going into 2026, so that we can expand the charts we offer and maintain the same polished experience across Observable tools.

Seth Engelhard
Want to keep up with what’s happening at Observable? Sign up to receive our monthly newsletter. We’ll see you in the new year!