

AI
WARNING
Observable collects AI conversations to evaluate and improve user experience. Any messages with AI may be reviewed by Observable staff. To opt out of AI, contact your Observable support representative.
Canvases’ AI assistant — built on Claude by Anthropic — allows you to ask questions about your data and generate tables and charts with natural language. It builds on your work and puts its own work alongside yours on the canvas, so that you can check its assumptions, verify its results, and build on its analyses.
For example, on a canvas connected to a database with tables of customers and purchases, you might ask:
- “Join customers and purchases”
- “Which demographics generated the most revenue?”
- “Which products are especially popular in California?”
- “Who are the top customers to contact heading into summer?”
Using AI
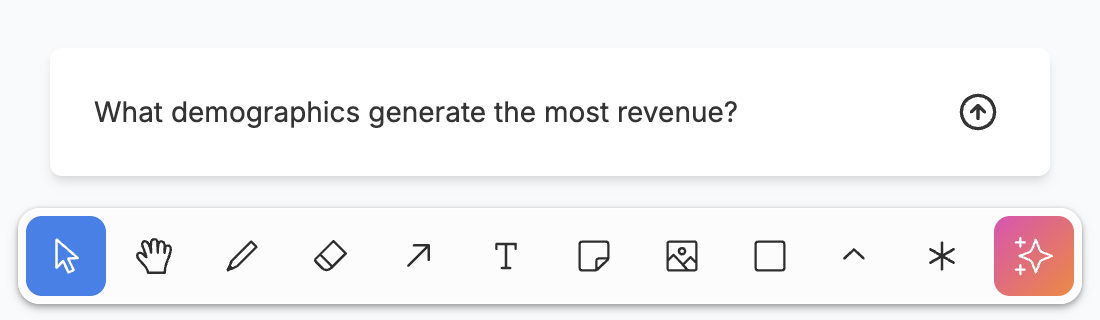
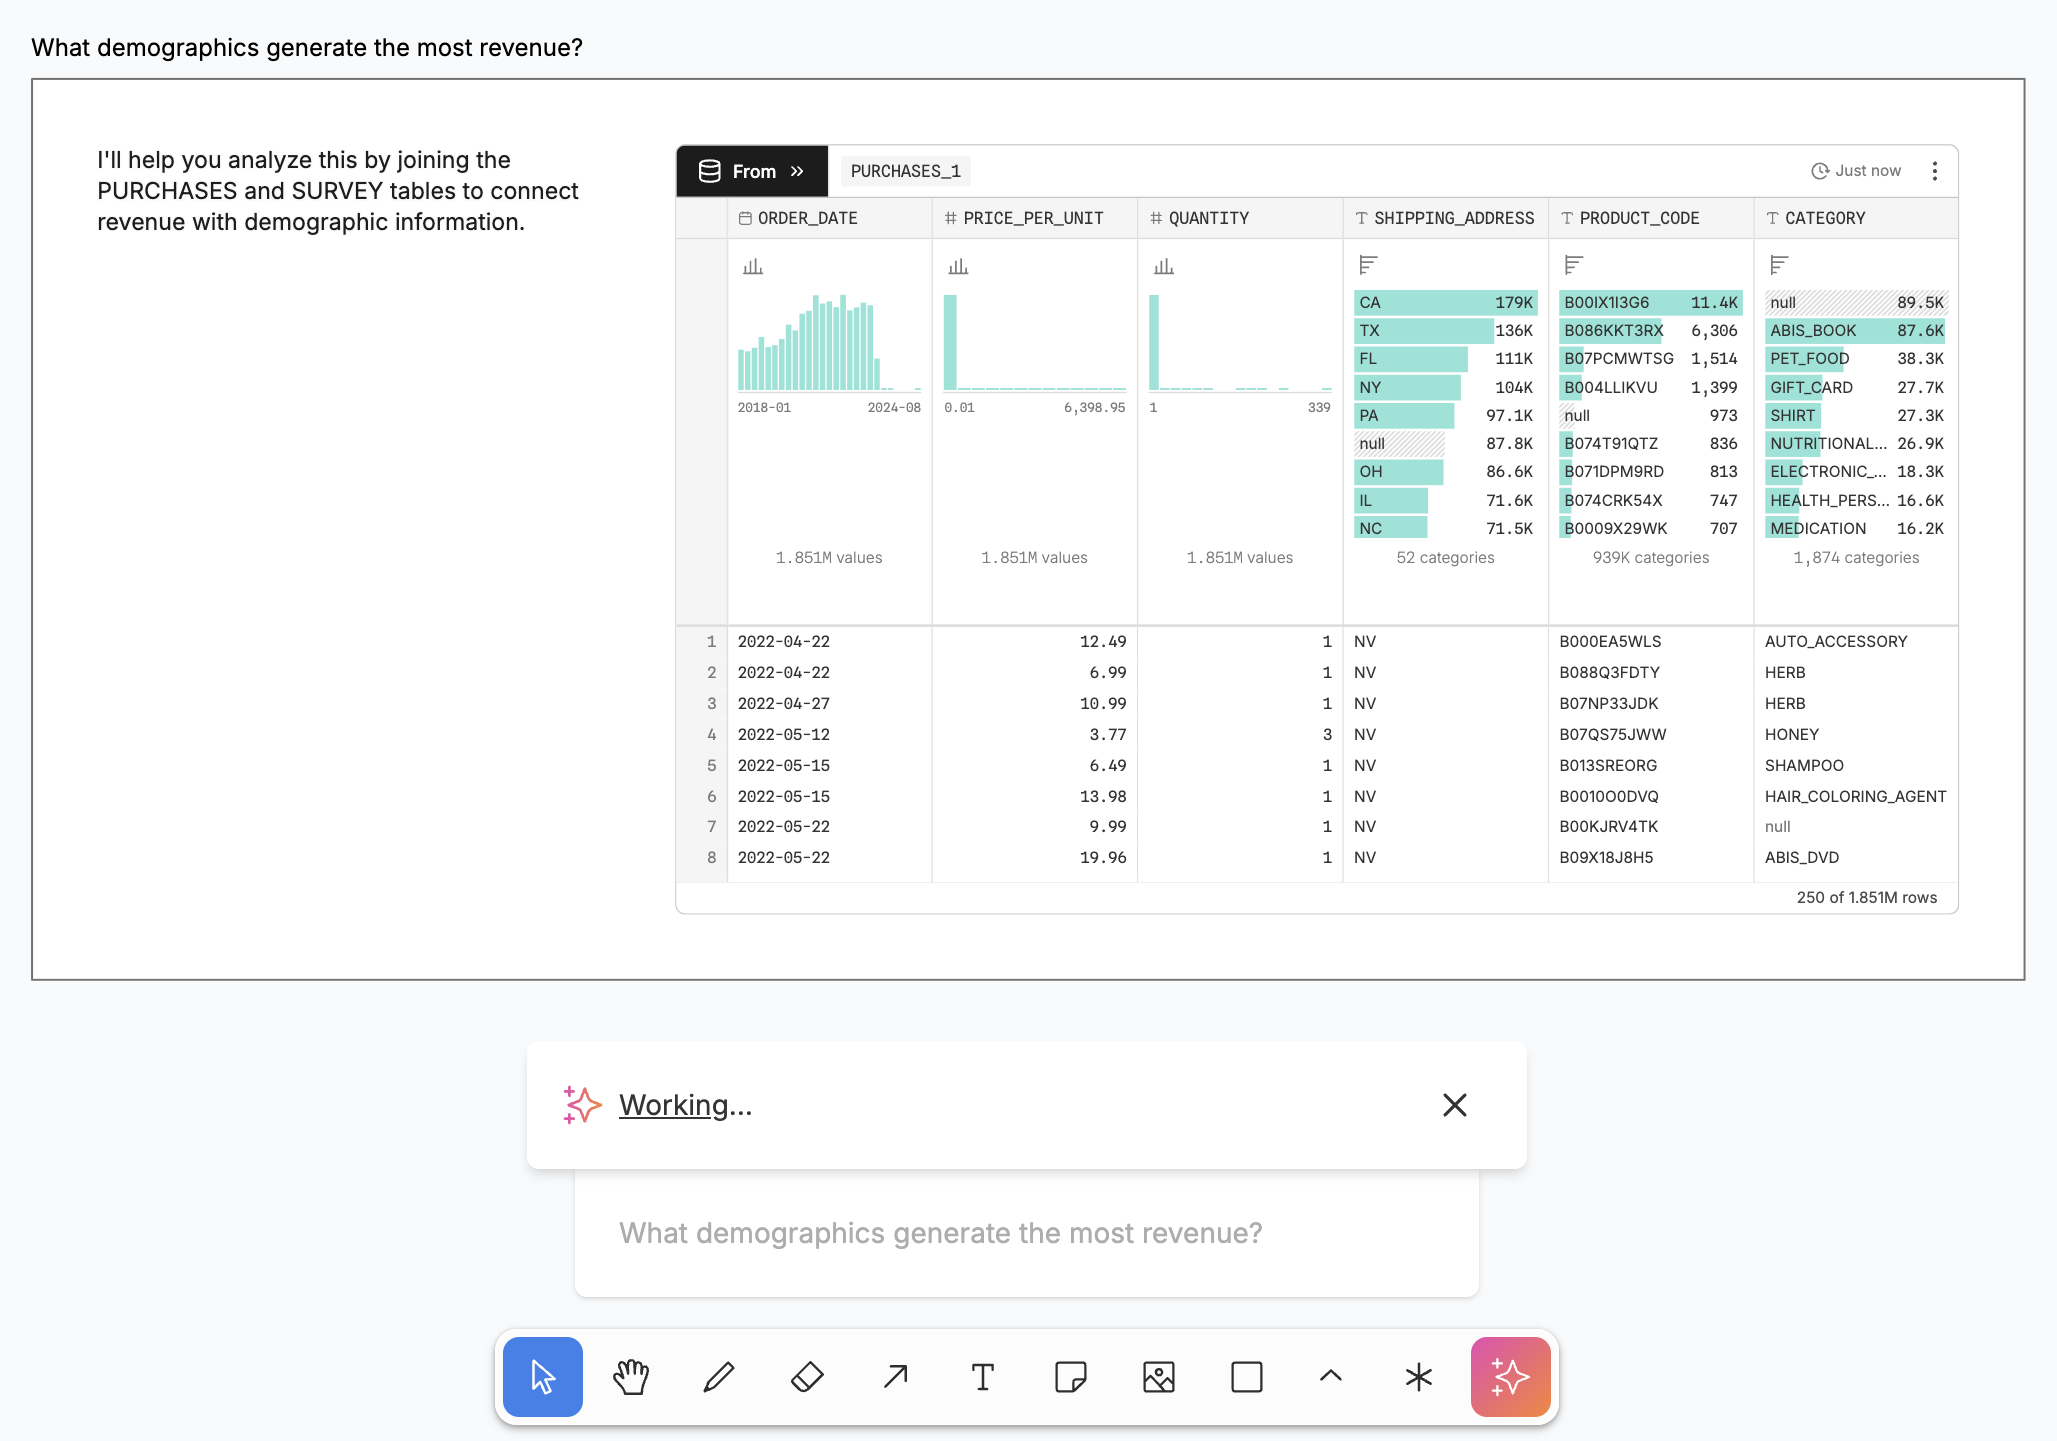
Click the  AI icon in the toolbar to open the AI input, then type your question and press return or click the send button . AI will think for a moment, choose an empty spot on the canvas, and begin putting its work in a frame labeled with your prompt. Click “Working…” (while work is in progress) or “See the response” (once done) to jump to its work.
Once it’s done, you can ask another question. Unlike a chat bot, there is no scrolling chat history. AI looks at and acts on the current page of the canvas, where all collaborators can see and edit its work.
Stop AI by clicking “×”. Cycle through past prompts by pressing the up and down arrow keys in the input field.
AI can ask you questions, too:
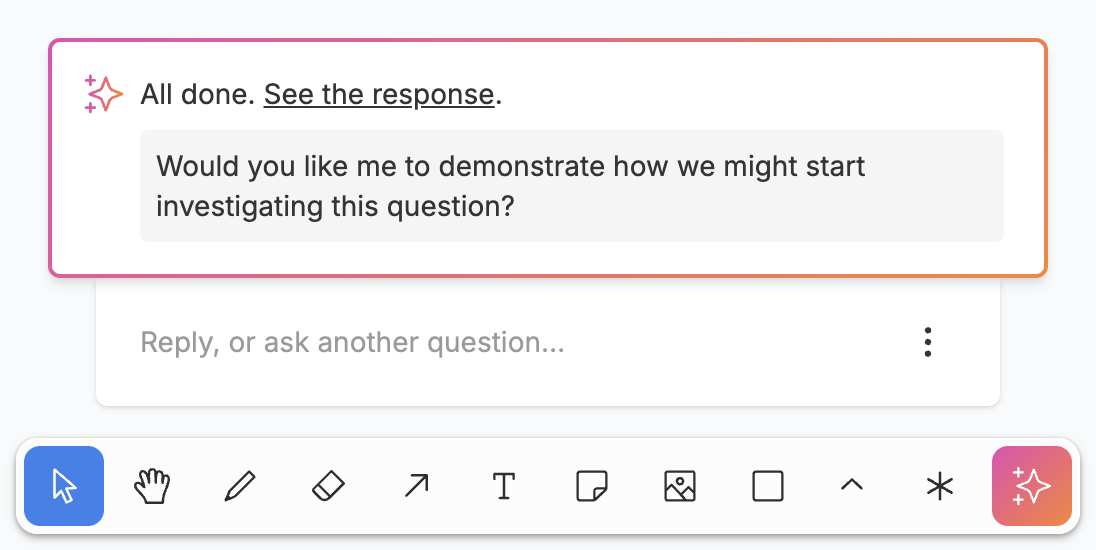
You can answer its questions directly, or ignore them and ask about something else.
What AI can see
What AI sees is based on what you see: the tables, charts, text, and selections in your viewport. Your viewport has a strong effect on how AI responds, so it helps to zoom in on the nodes you’re talking about.
For tables, AI sees the columns, the column summaries, and a sample of the first rows. For charts, it sees a description that varies depending on the chart type. To call attention to a particular node, select it before sending your prompt, or refer to it by name in your prompt.
Outside the viewport, AI can see its last output frame, if the frame is on the current page. At its discretion, it may choose to look at the rest of the page. It cannot look outside the current page, and it will stop its current task if you switch pages.
Much like you can always see your data source’s schema on the left of the screen, AI can also always see your connected data source’s schema: the tables available, their columns and types, and any comments stored in the schema.
INFO
AI in canvases is not “multimodal”. It cannot see the canvas as an image, so it cannot see or interpret shapes, drawings, or photos you’ve added to the canvas.
What AI can do
AI can only add things to the canvas, not edit or remove them. It modifies existing work by adding new versions, not by changing things in-place.
For data analysis, it can use the same nodes you can use to filter, sort, group, and join tables. It can also write SQL expressions to derive new columns for tables.
For visualization, it can use any of the chart types in the chart node. For example, it can make bar charts, scatterplots, histograms, and treemaps, each with various options.
Its tables and charts can be built atop the other nodes on the canvas. For example, you or AI may have previously derived a new column defining a new business metric; it can then use that metric in its analysis and visualizations.
Undo AI’s work using the normal undo button or keyboard shortcut (Cmd-Z or Ctrl-Z).
TIP
For granular control over what AI can do, click the main menu (upper left), open the “Developer tools” menu, and select “Show AI options”. The toolbar will then show a “⋮” menu to toggle individual tools. To let the AI write code (experimental), enable customSqlQuery (SQL node) and customPlot (JavaScript node).