

Dashboards
Obseravable dashboards allow you to quickly build interactive dashboards from charts, tables, and controls in your canvas. Dashboards extend the functionality of your canvas, making it easy to create views for stakeholders who don’t need to change node settings or adjust layouts.
The dashboard builder
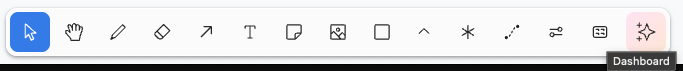
To create a dashboard, click on the dashboard icon found in the toolbar to create a new dashboard builder:
After selecting the dashboard builder, click on your canvas to add it to the page.
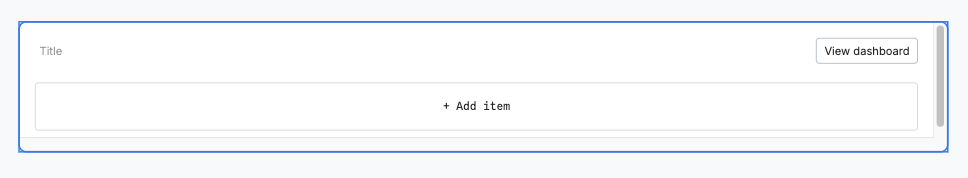
There are three main areas to the dashboard builder:
- Title: a text field for what you want to name your dashboard, which will appear at the top of the dashboard.
- Items: a grid system to add items to your dashboard. Click + Add item to see a list of all the dashboard acceptable nodes from your canvas. Nodes are referenced by name.
- View dashboard: navigation to your rendered dashboard.
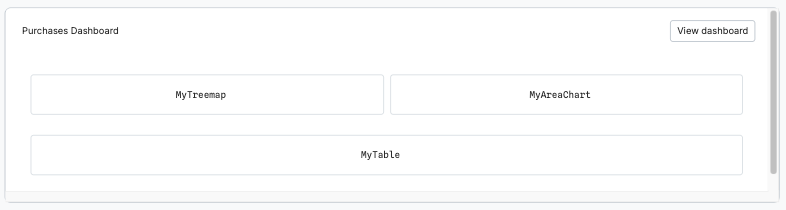
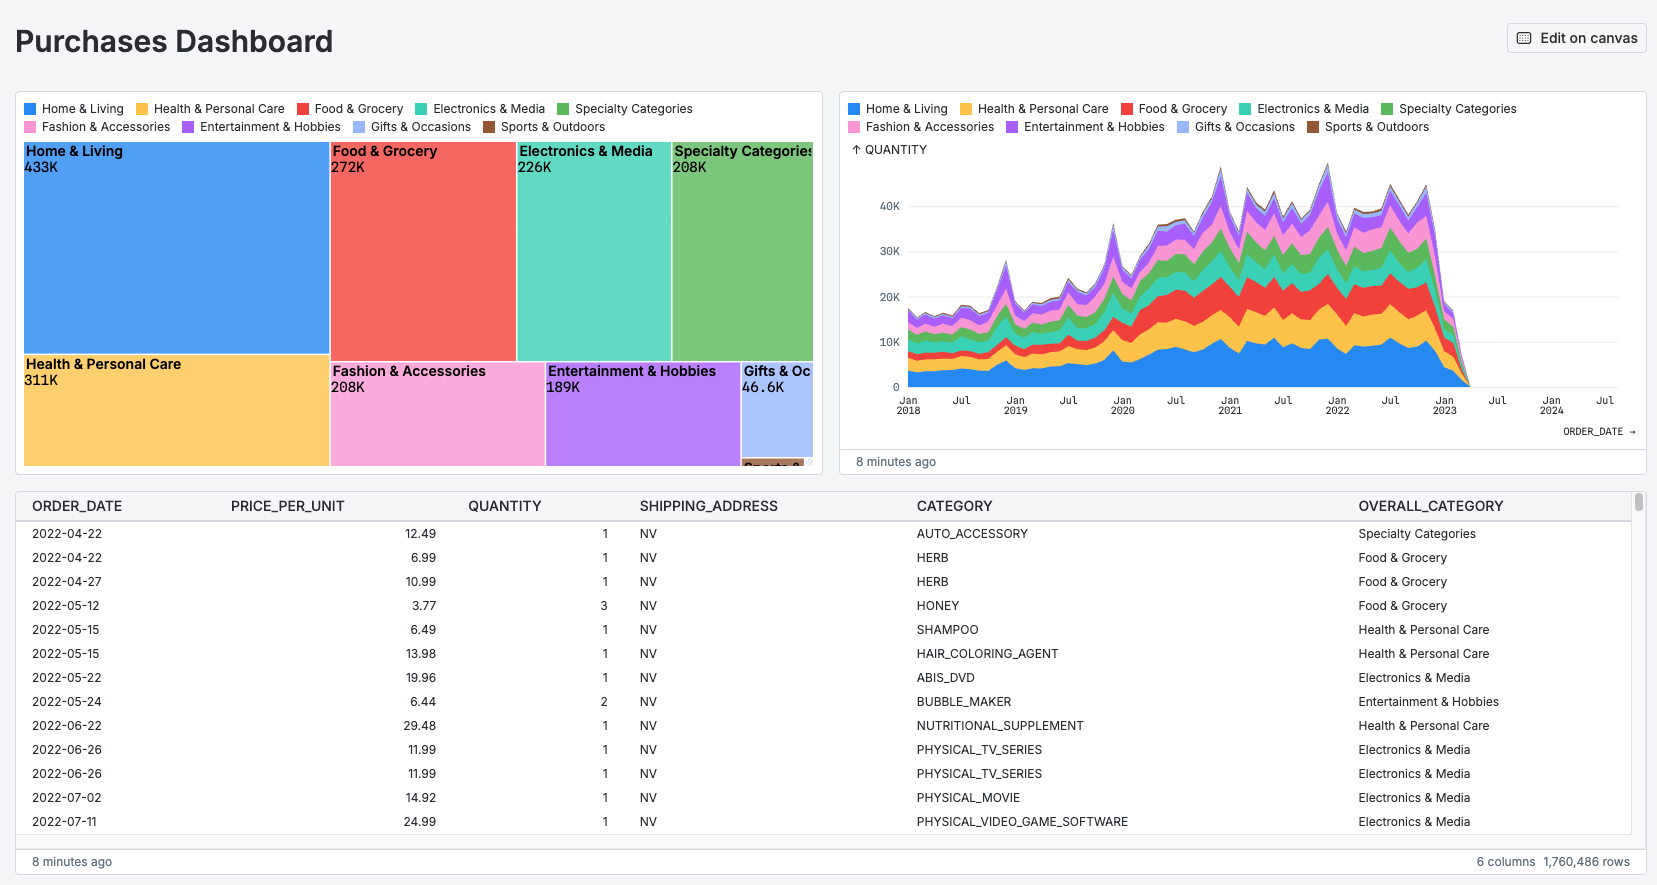
When you fill in your dashboard builder with nodes from your canvas, you can click on the View Dashboard button to see the rendered version of your dashboard. When nodes are rendered on the dashboard, header sections and options will be removed.
Editing
Double-click on the dashboard builder to go into edit mode. In edit mode, you’ll see “+” symbols that allow you to add items above, below or beside other items. There is a maximum of 12 items allowed for each row of your dashboard, but there is no limit to the number of rows you can have within your dashboard.
To remove an item from your dashboard, delete the node name from the item and click outside of the dashboard builder to exit edit mode.
Note: when you make changes to your dashboard, they are immediately available to anyone with access to your dashboard.
Sharing
To get a shareable link for your dashboard, click on the View dashboard button on the dashboard builder and copy the link from the new page. Dashboards assume the same permissions as your canvas, so only users with access to your canvas will be able to access the dashboard.