

Data sources
Each canvas has an underlying data source where queries run. These queries are used to render summary tables and charts. Choose your data source when creating a new canvas. The canvas’s data source cannot be changed after the canvas is created.
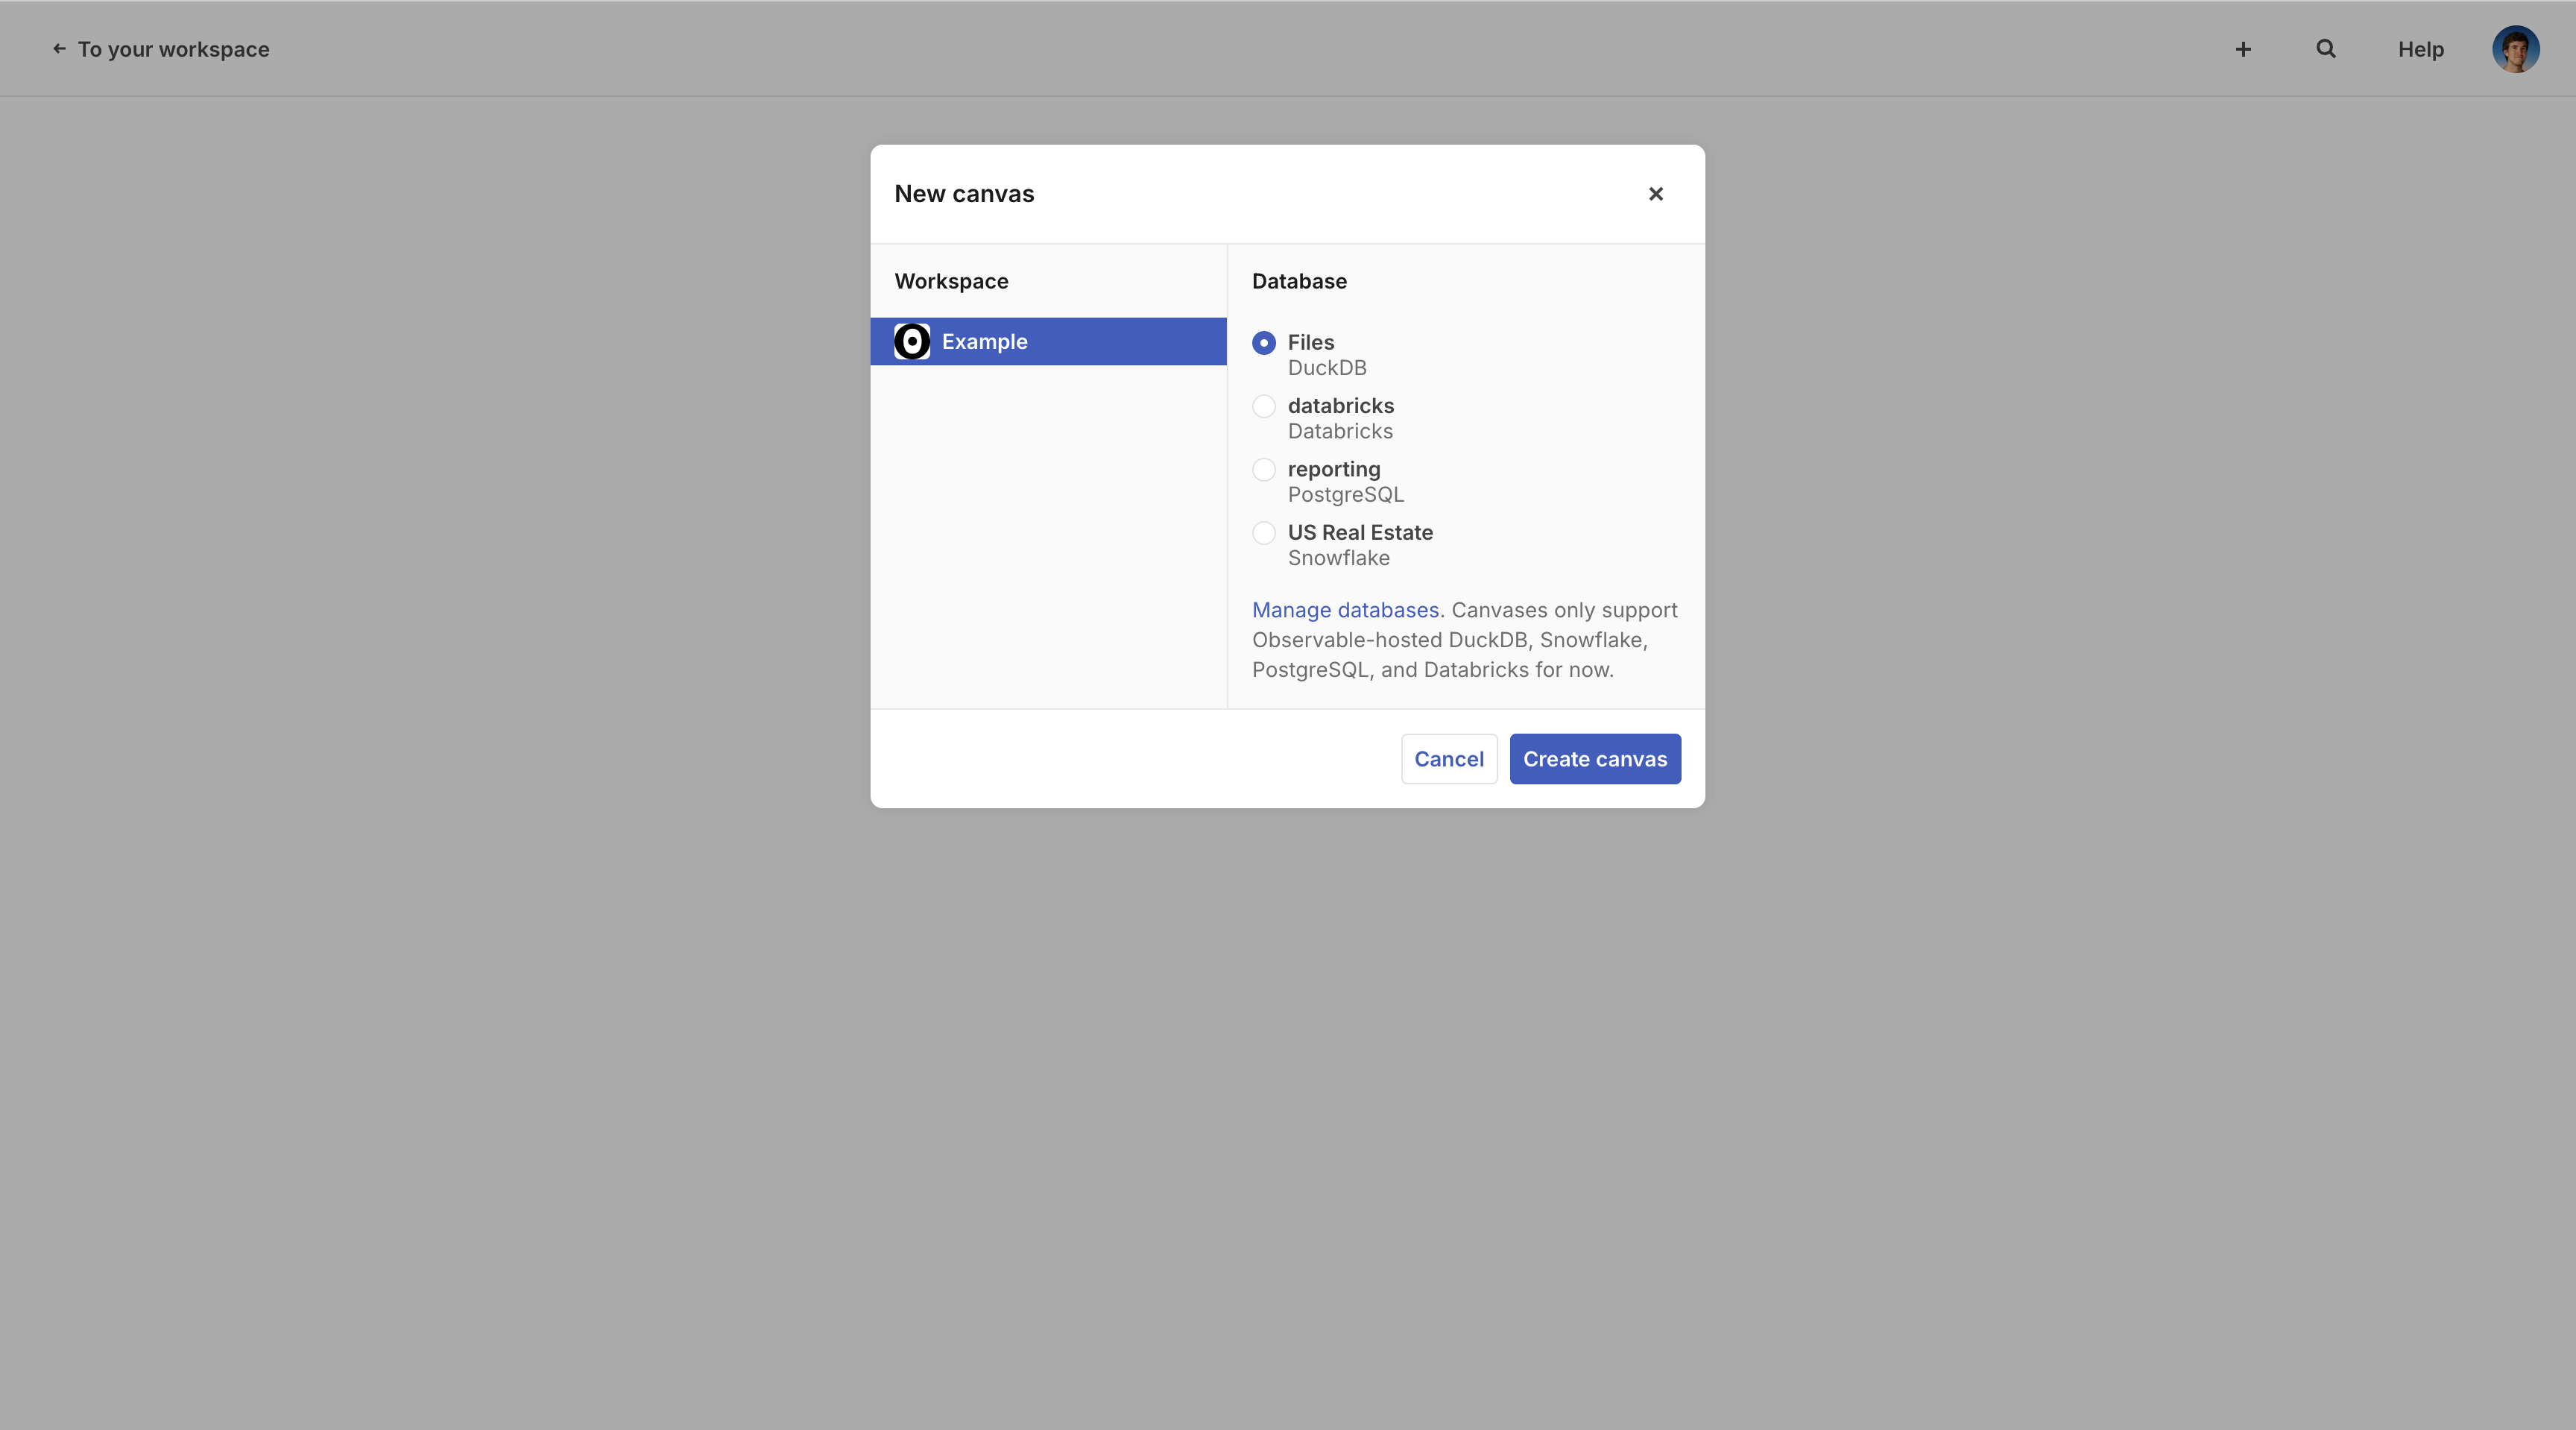
You can connect to your remote database or data warehouse using Snowflake, Databricks, and PostgreSQL. Or, you can upload local files to a DuckDB canvas.
| Connector | Driver version |
|---|---|
| Databricks | 1.11.0 (details) |
| DuckDB (duckdb-wasm) | 1.29.0 (details) |
| PostgreSQL | 3.4.7 (details) |
| Snowflake | 2.2.0 (details) |
NOTE
A canvas can only have one data source, and hence you cannot join data across different sources. For more options, see notebooks.
Remote data sources
Remote data sources must first be added to your Observable workspace. If you haven’t done this yet, go to Databases, and then click New database in the top right.
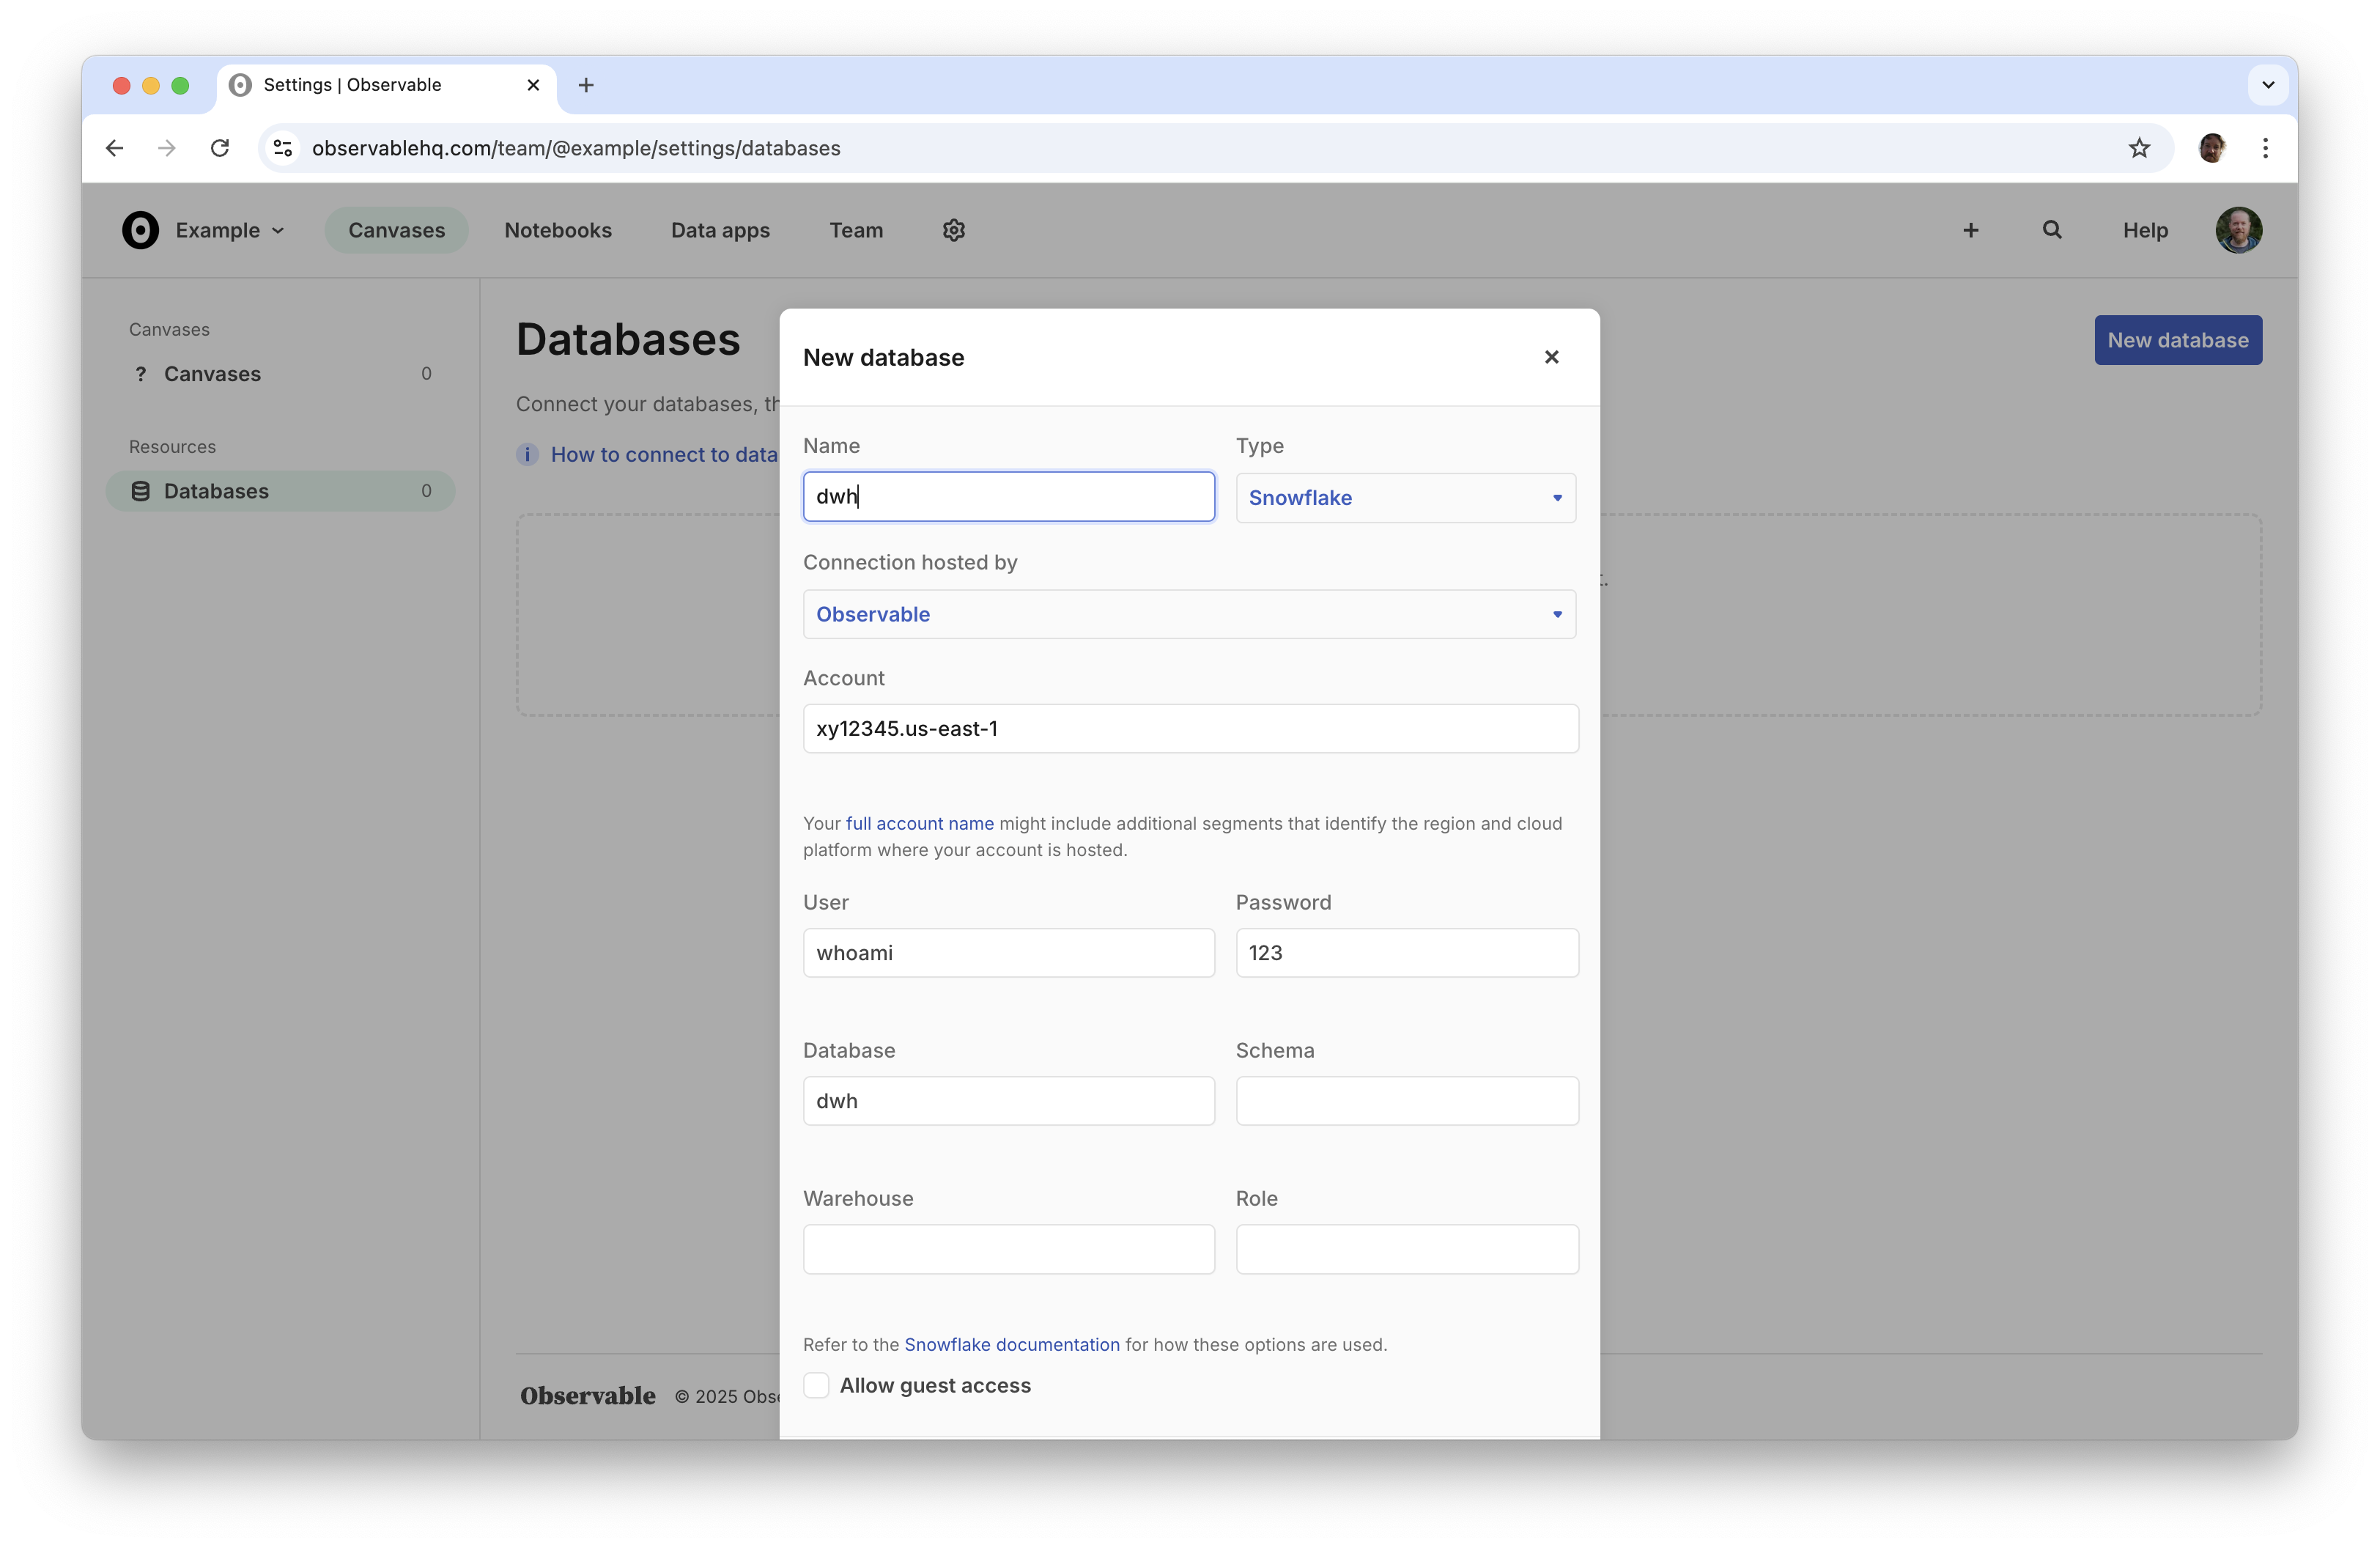
Name your database, enter your database credentials, and then click Add new.
Snowflake
Refer to the Snowflake documentation for help connecting to Snowflake, such as determining your account identifier, schema, warehouse, and role values. Refer to the Snowflake SQL command reference for detailed information on writing SQL queries.
The schema specified in the Snowflake connection settings will be used as the default schema. Canvases show all available schemas, but will use the default schema if you reference a table without qualifying it with a schema (as in FROM ambiguous_table_name).
PostgreSQL
We support PostgreSQL data sources in canvases, but they tend to be slower. PostgreSQL is an Online Transaction Processing (OLTP) system; for fast exploratory data analysis, we recommend an Online Analytical Processing (OLAP) system like Snowflake or Databricks.
We only support the official PostgreSQL. We are not necessarily compatible with other “PostgreSQL-compatible” databases, which share a wire protocol but vary in their schemas and the sort of metadata available.
Databricks
Connecting to Databricks requires a machine user with a username and password or personal access token.
We only list schemas in the default catalog.
Allow-listing our servers
If your database requires allow-listing, you should allow the following IP addresses:
44.193.71.39
44.197.63.115
44.205.191.175
44.206.16.243
Local files (DuckDB)
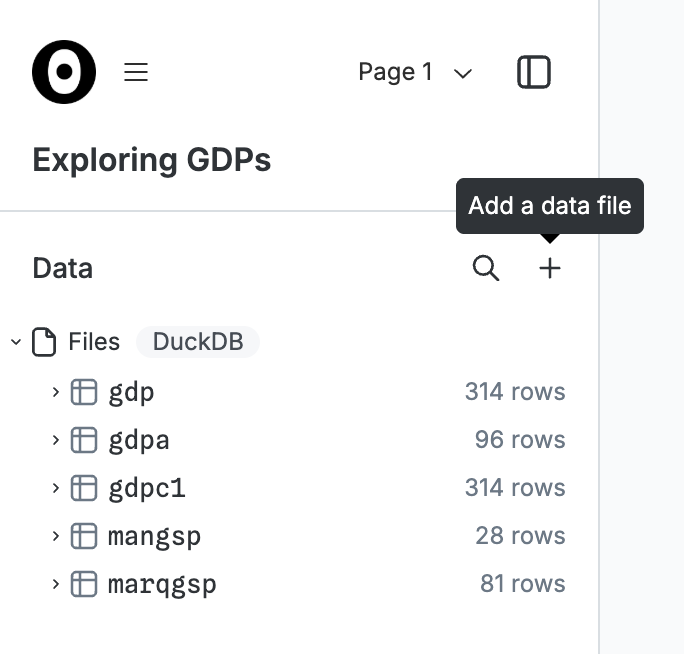
You can explore local files in a canvas by choosing the “Files” (DuckDB) option when creating a new canvas. Click the “+” button in the data panel to select files to upload, or drag and drop the files onto the canvas. Canvases support CSV, TSV, XLSX, JSON, and Parquet files. (XLSX files only support the first sheet.)
You can also load files directly from URLs using DuckDB’s data import functions like read_csv, read_json, and read_parquet. For example, in a DuckDB canvas, try making a SQL node and running the following query:
SELECT * FROM read_csv_auto("https://raw.githubusercontent.com/observablehq/plot/refs/heads/main/test/data/alphabet.csv")This uses the in-browser duckdb-wasm with the default extensions. Extensions are not configurable. Individual files are limited to 50 MB, and total files in a canvas are limited to 4 GB.
NOTE
Canvases do not support secrets, so loading files from URLs cannot depend on passing in sensitive passwords, e.g. for a private S3 bucket. To use secrets, see notebooks.
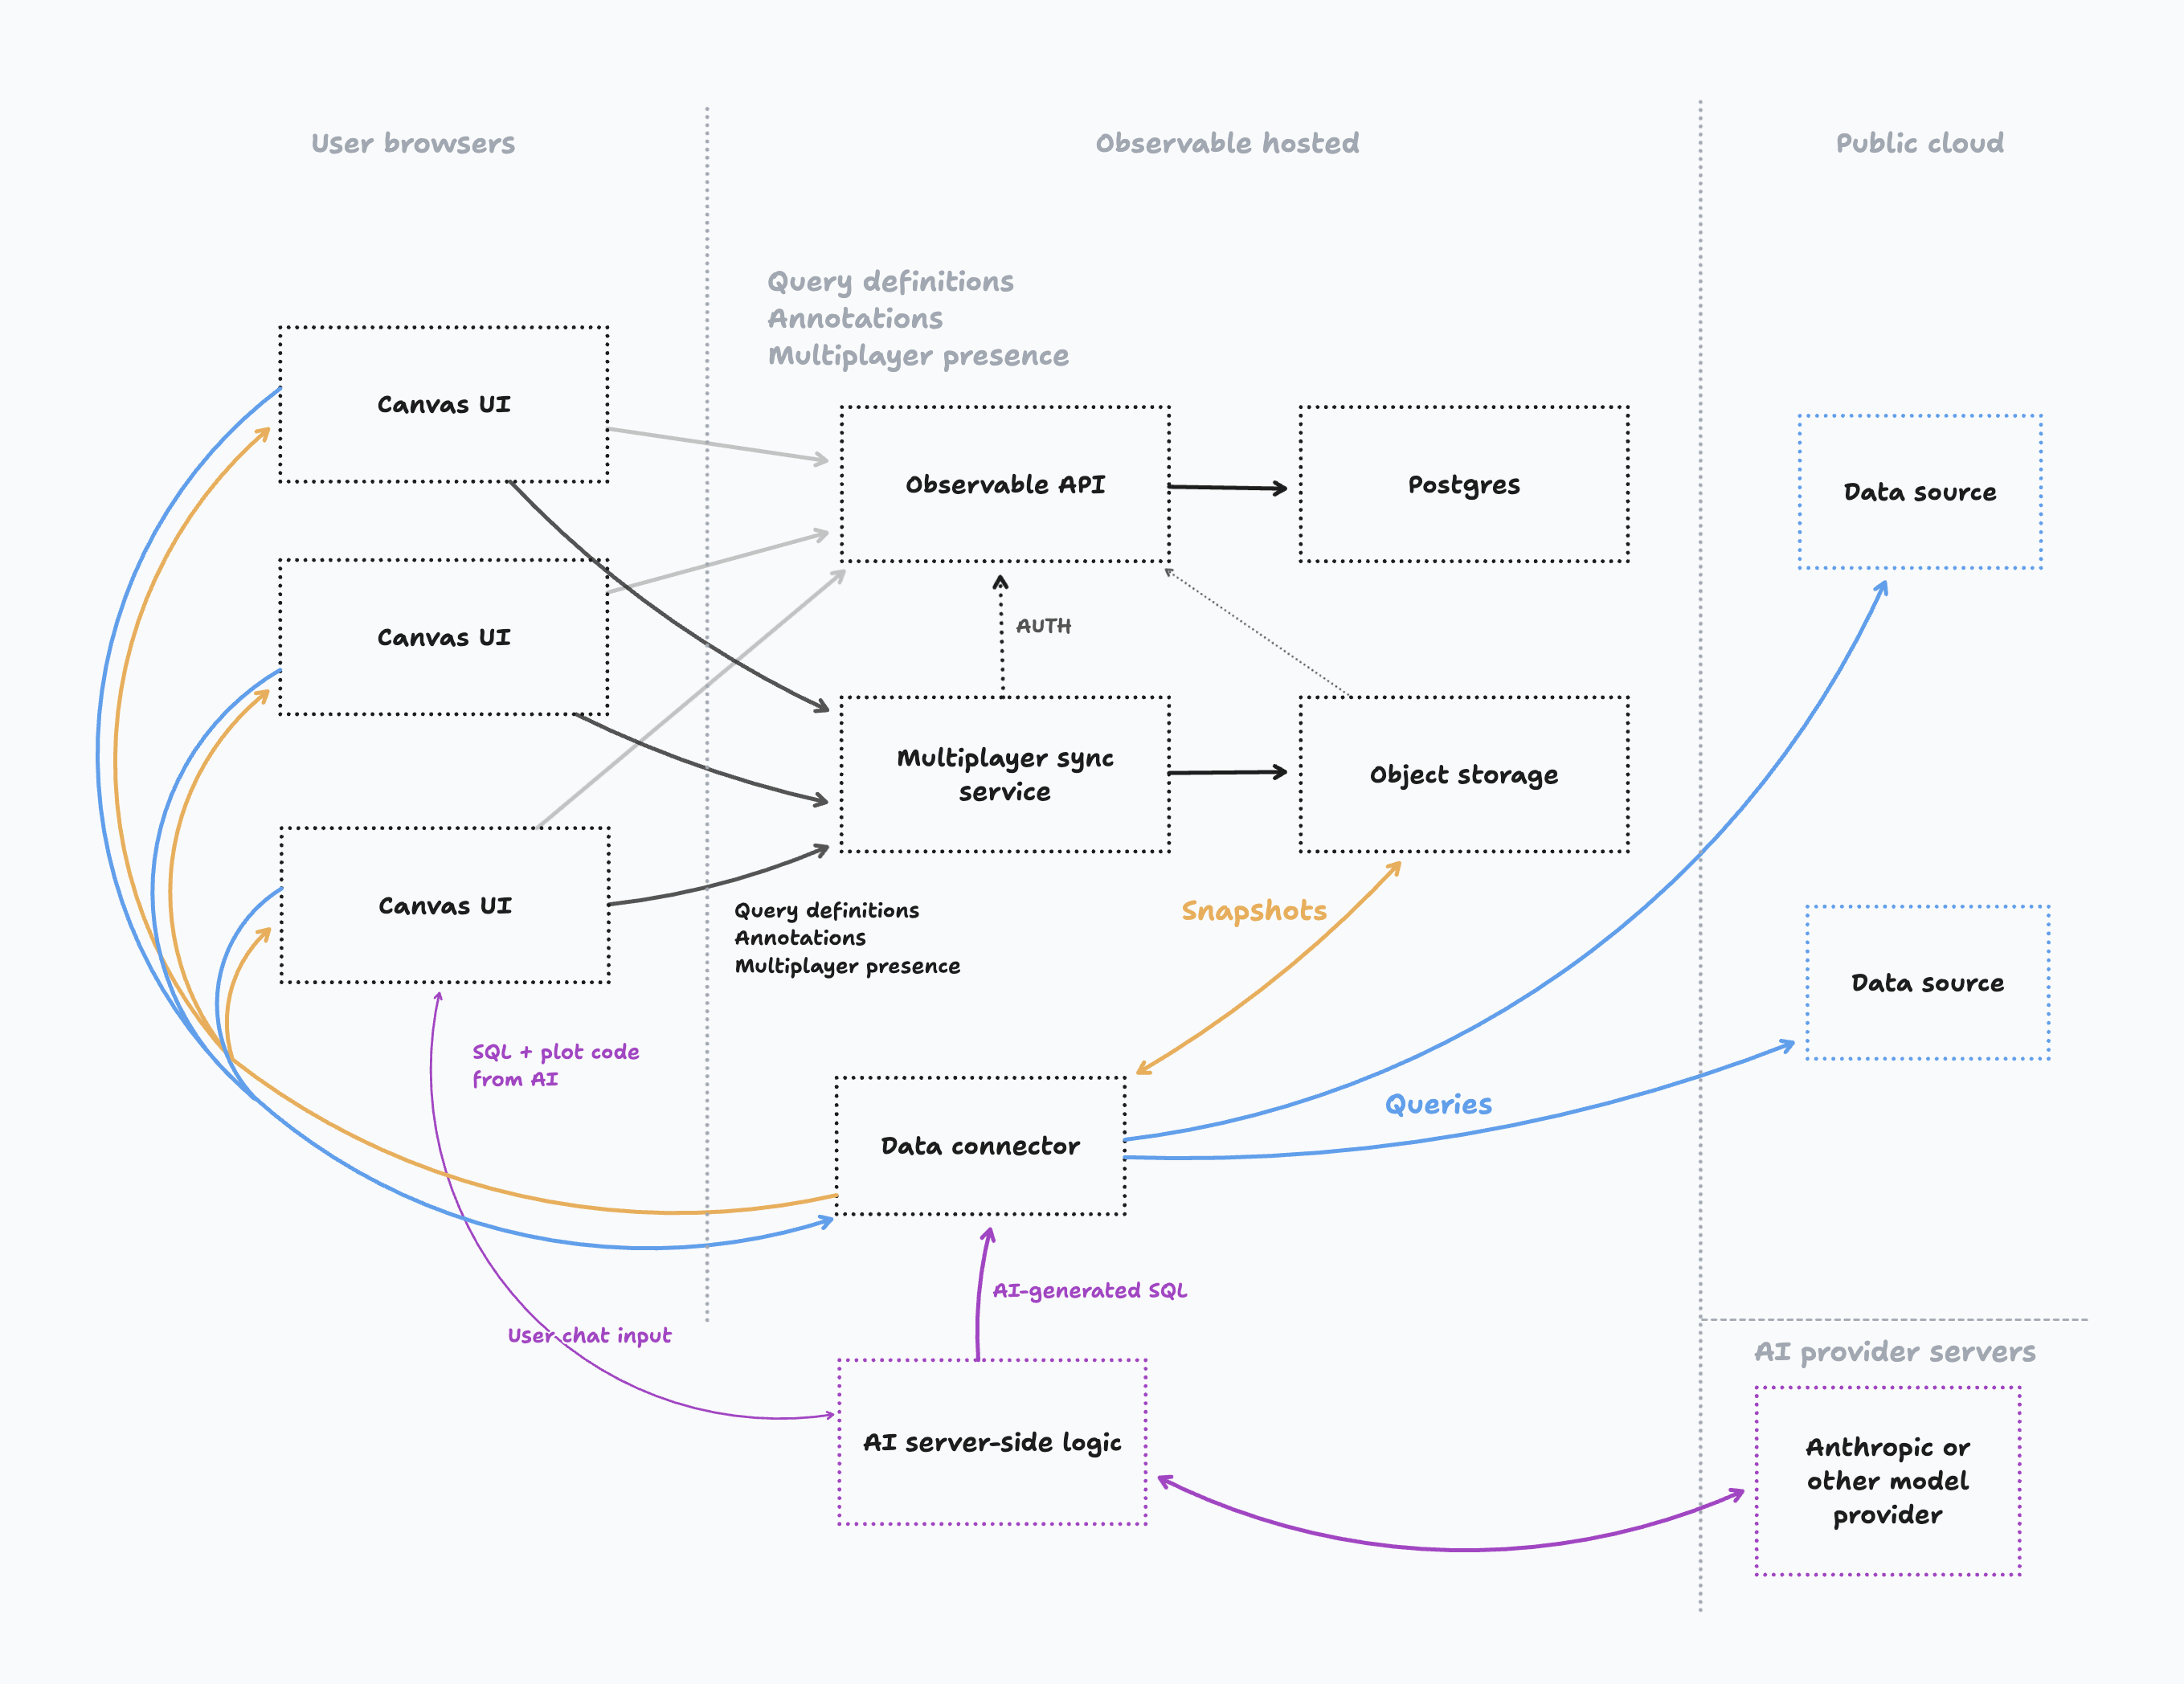
System architecture
Observable Canvases push compute to your data source, reducing the data that needs to be pulled into the browser, improving performance, and allowing you to work with larger datasets. Instead of loading the full results of queries defined by nodes, only aggregated summaries and sample rows are loaded. For example, if a node defines the query SELECT * FROM PURCHASES which would return 1.9M rows, the canvas only loads the first 250 rows as a sample, with additional queries to compute summary distributions for each column (such as binning the ORDER_DATE column by date).
To query remote data sources, Observable hosts a data connector; this data connector receives requests from browsers and issues a corresponding query on the corresponding data source; query results are then returned to the browser for display, and typically also persisted as query snapshots in Observable-hosted object storage. Query snapshots ensure that what you see on the canvas is consistent over time and between viewers.
Your remote data source must be accessible via the internet to Observable’s data connector. The data source credentials you supply when connecting a data source to your Observable workspace will only be used internally by Observable’s data connector; these credentials are not exposed to canvas users.