

Getting started
Go to https://observablehq.com/ and click the + in the top right to create a New canvas; alternatively, go directly to https://observablehq.com/new/canvas.
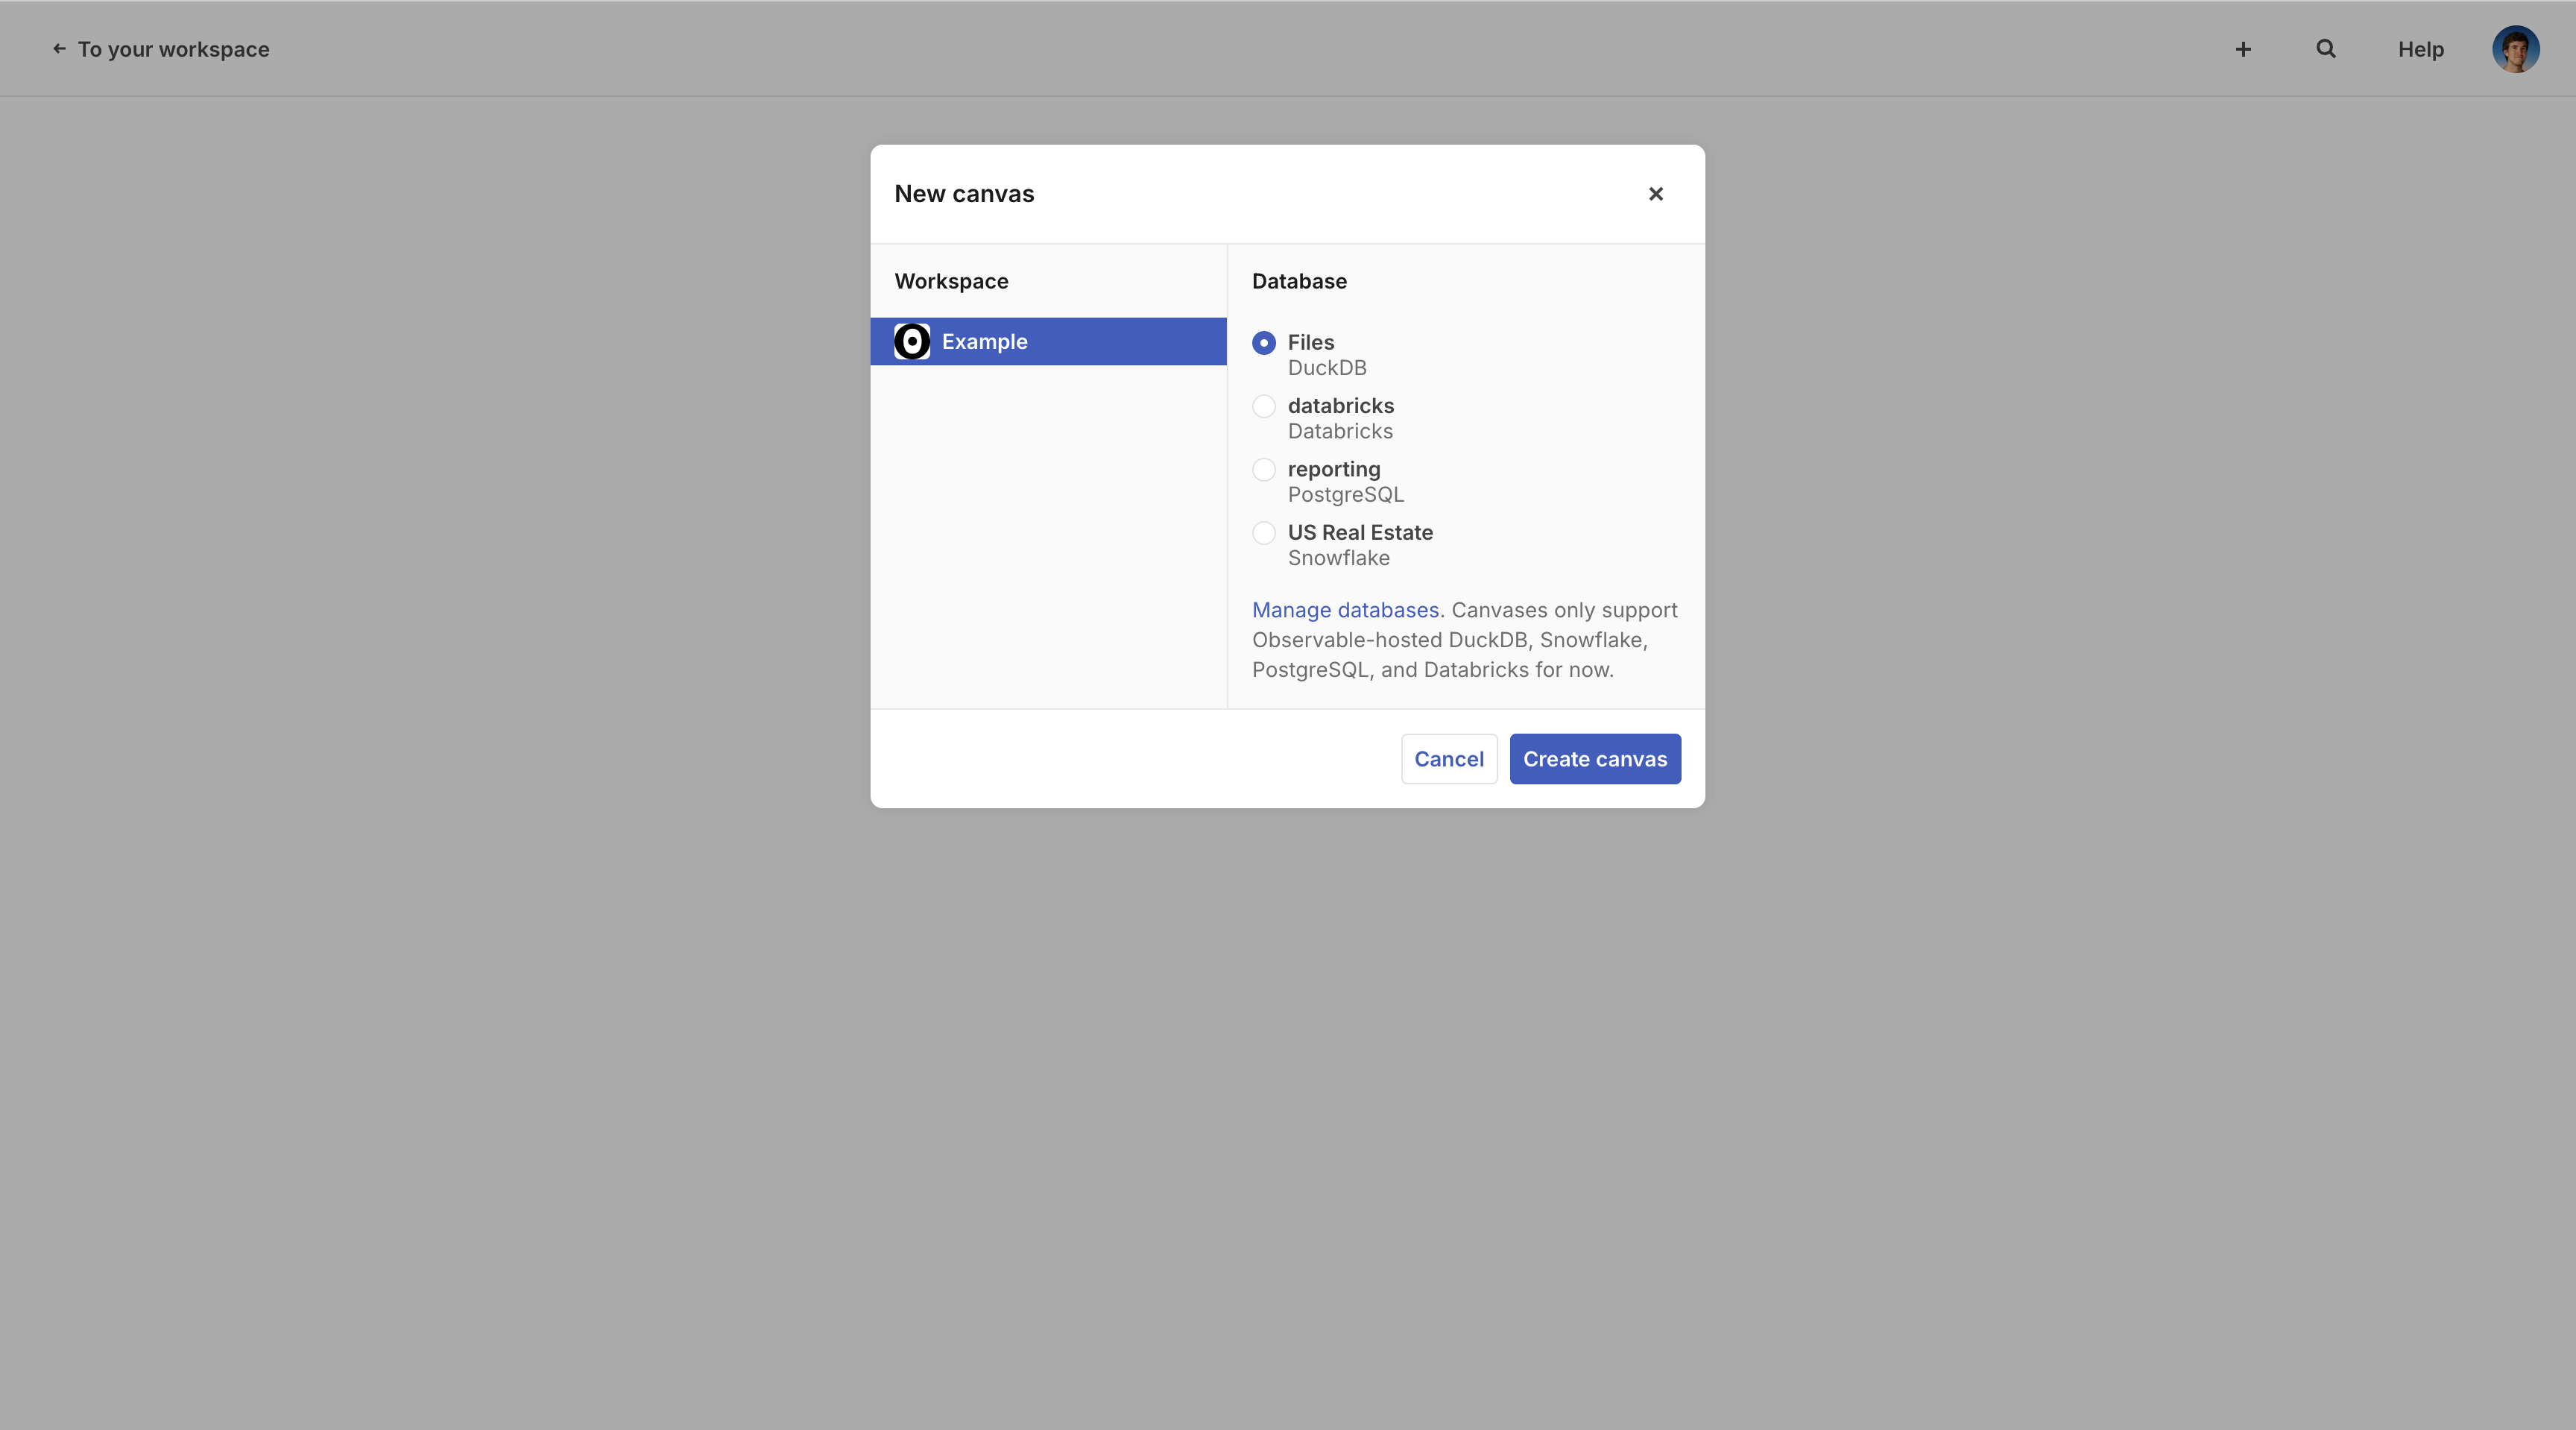
Select Files, then click Create canvas. You’ll now be redirected to your new, blank canvas, connected to a DuckDB data source.
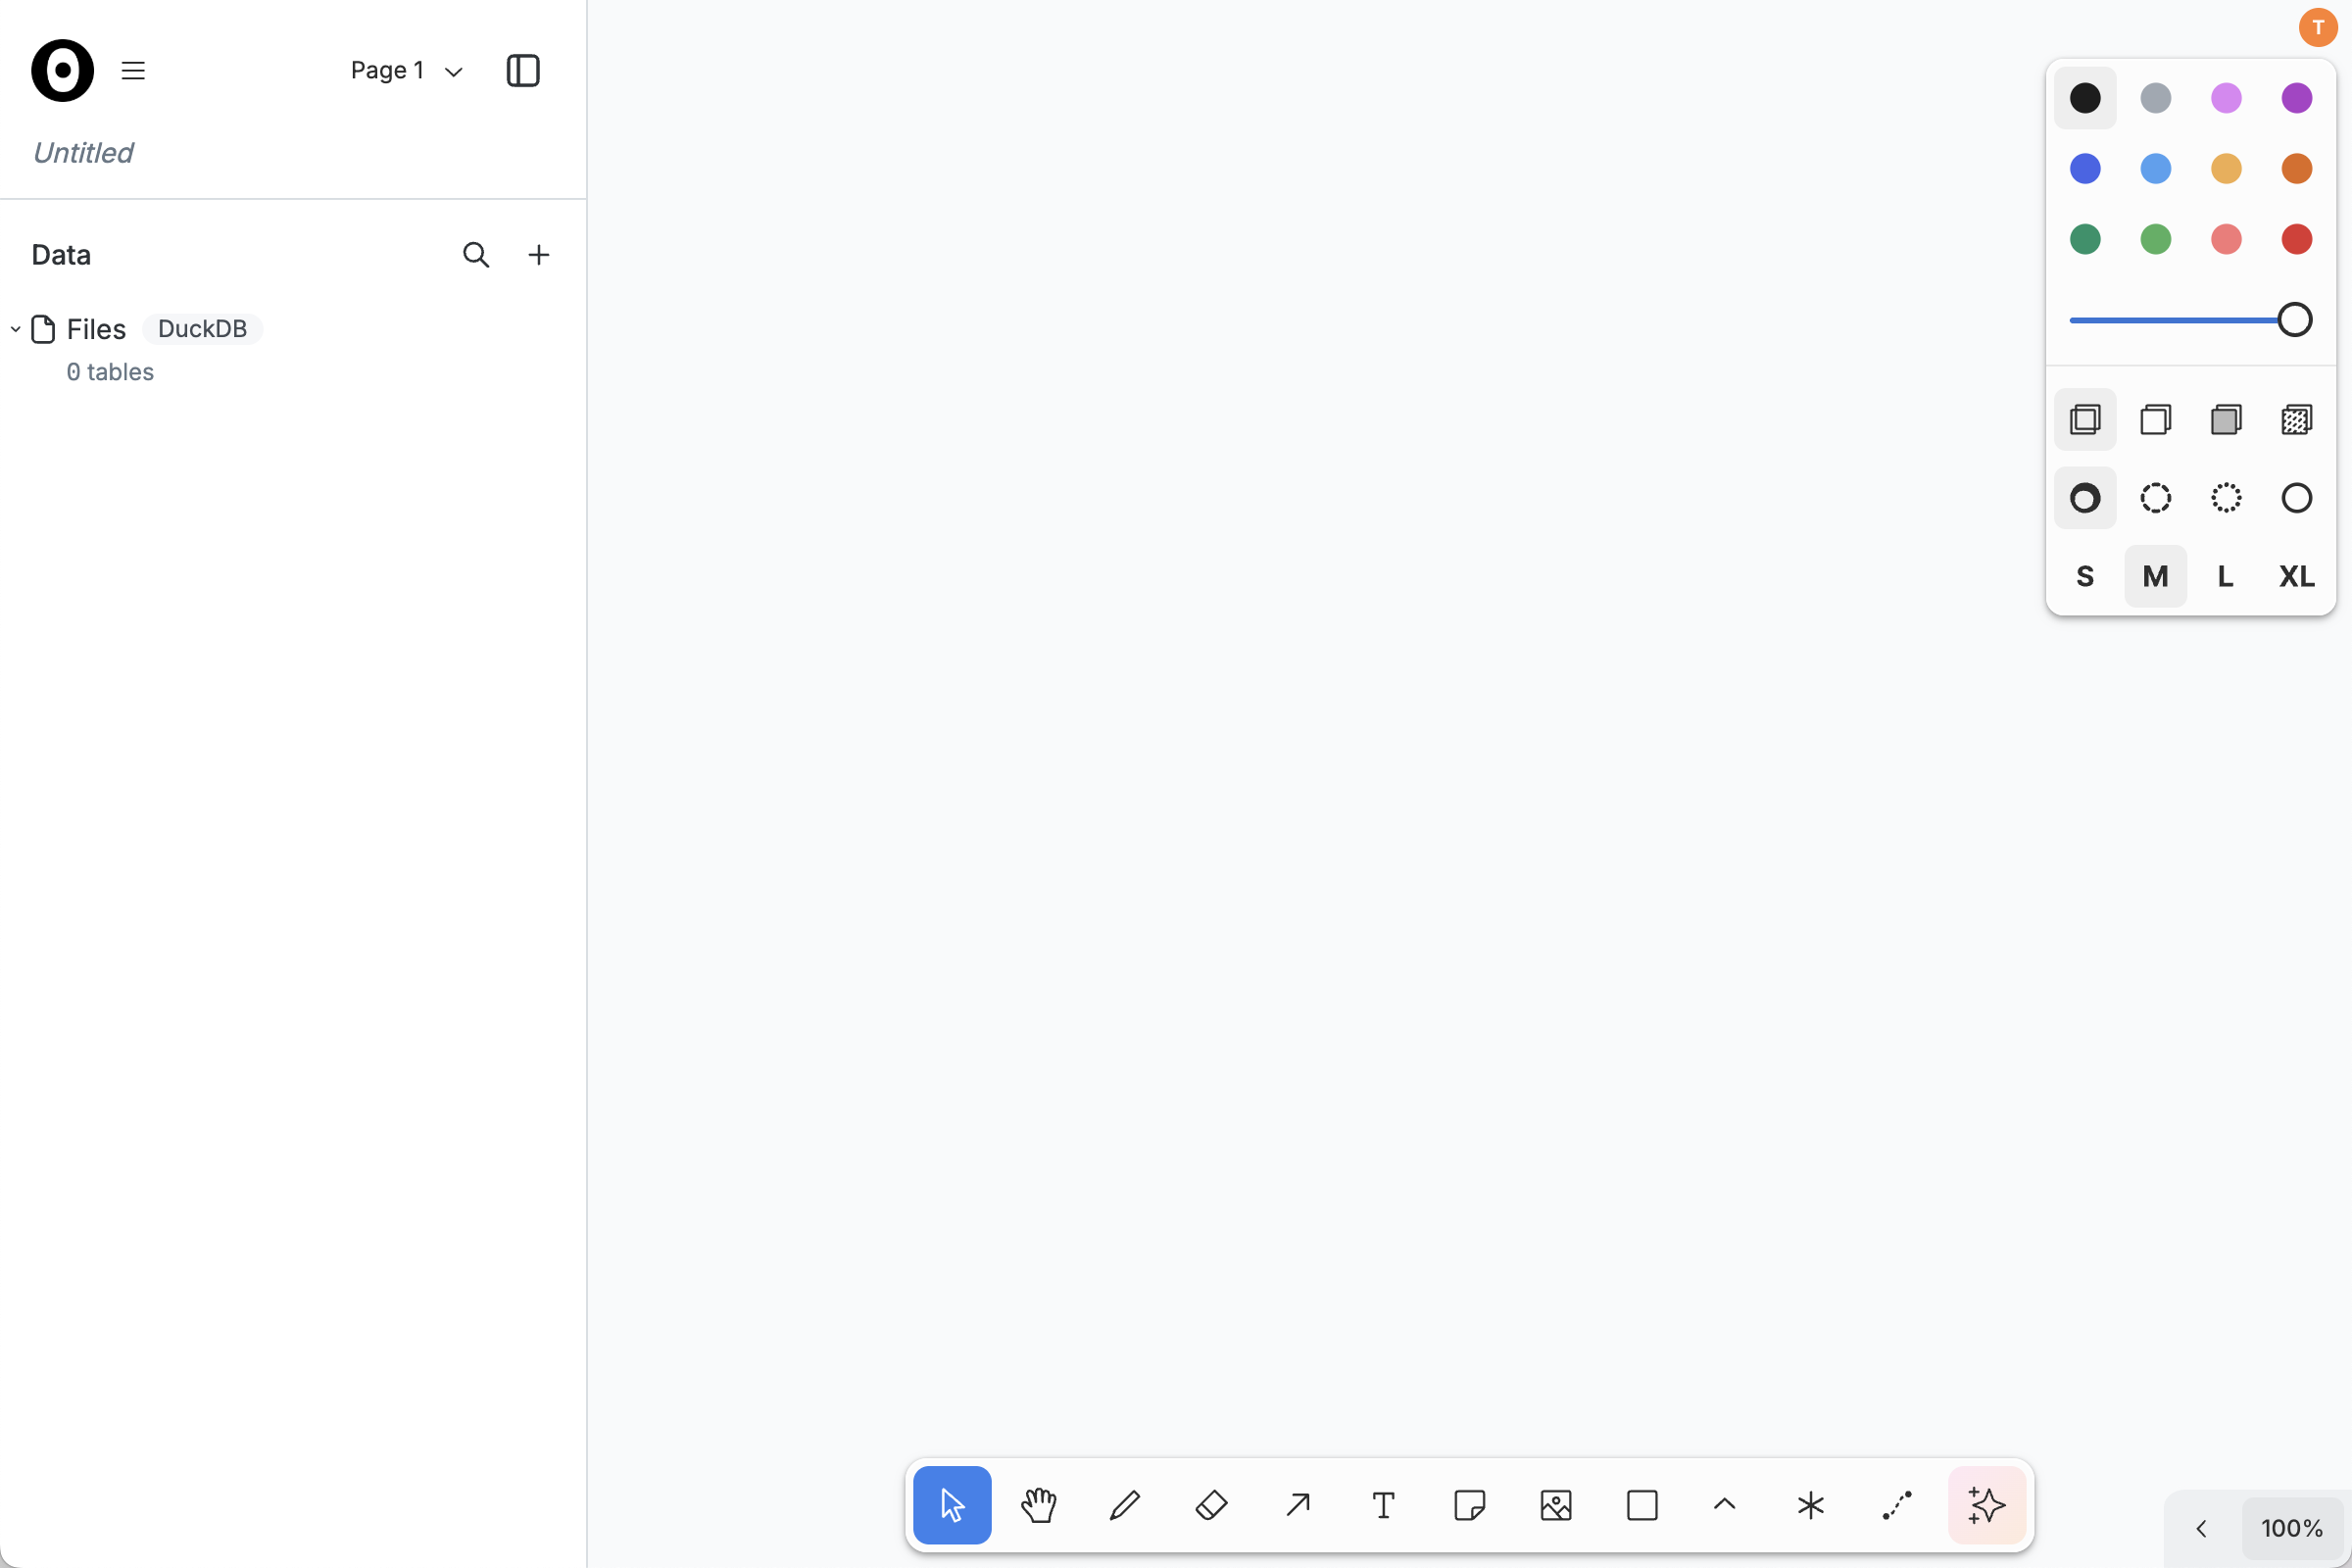
Click where it says Untitled in the title card to give your canvas a memorable title.
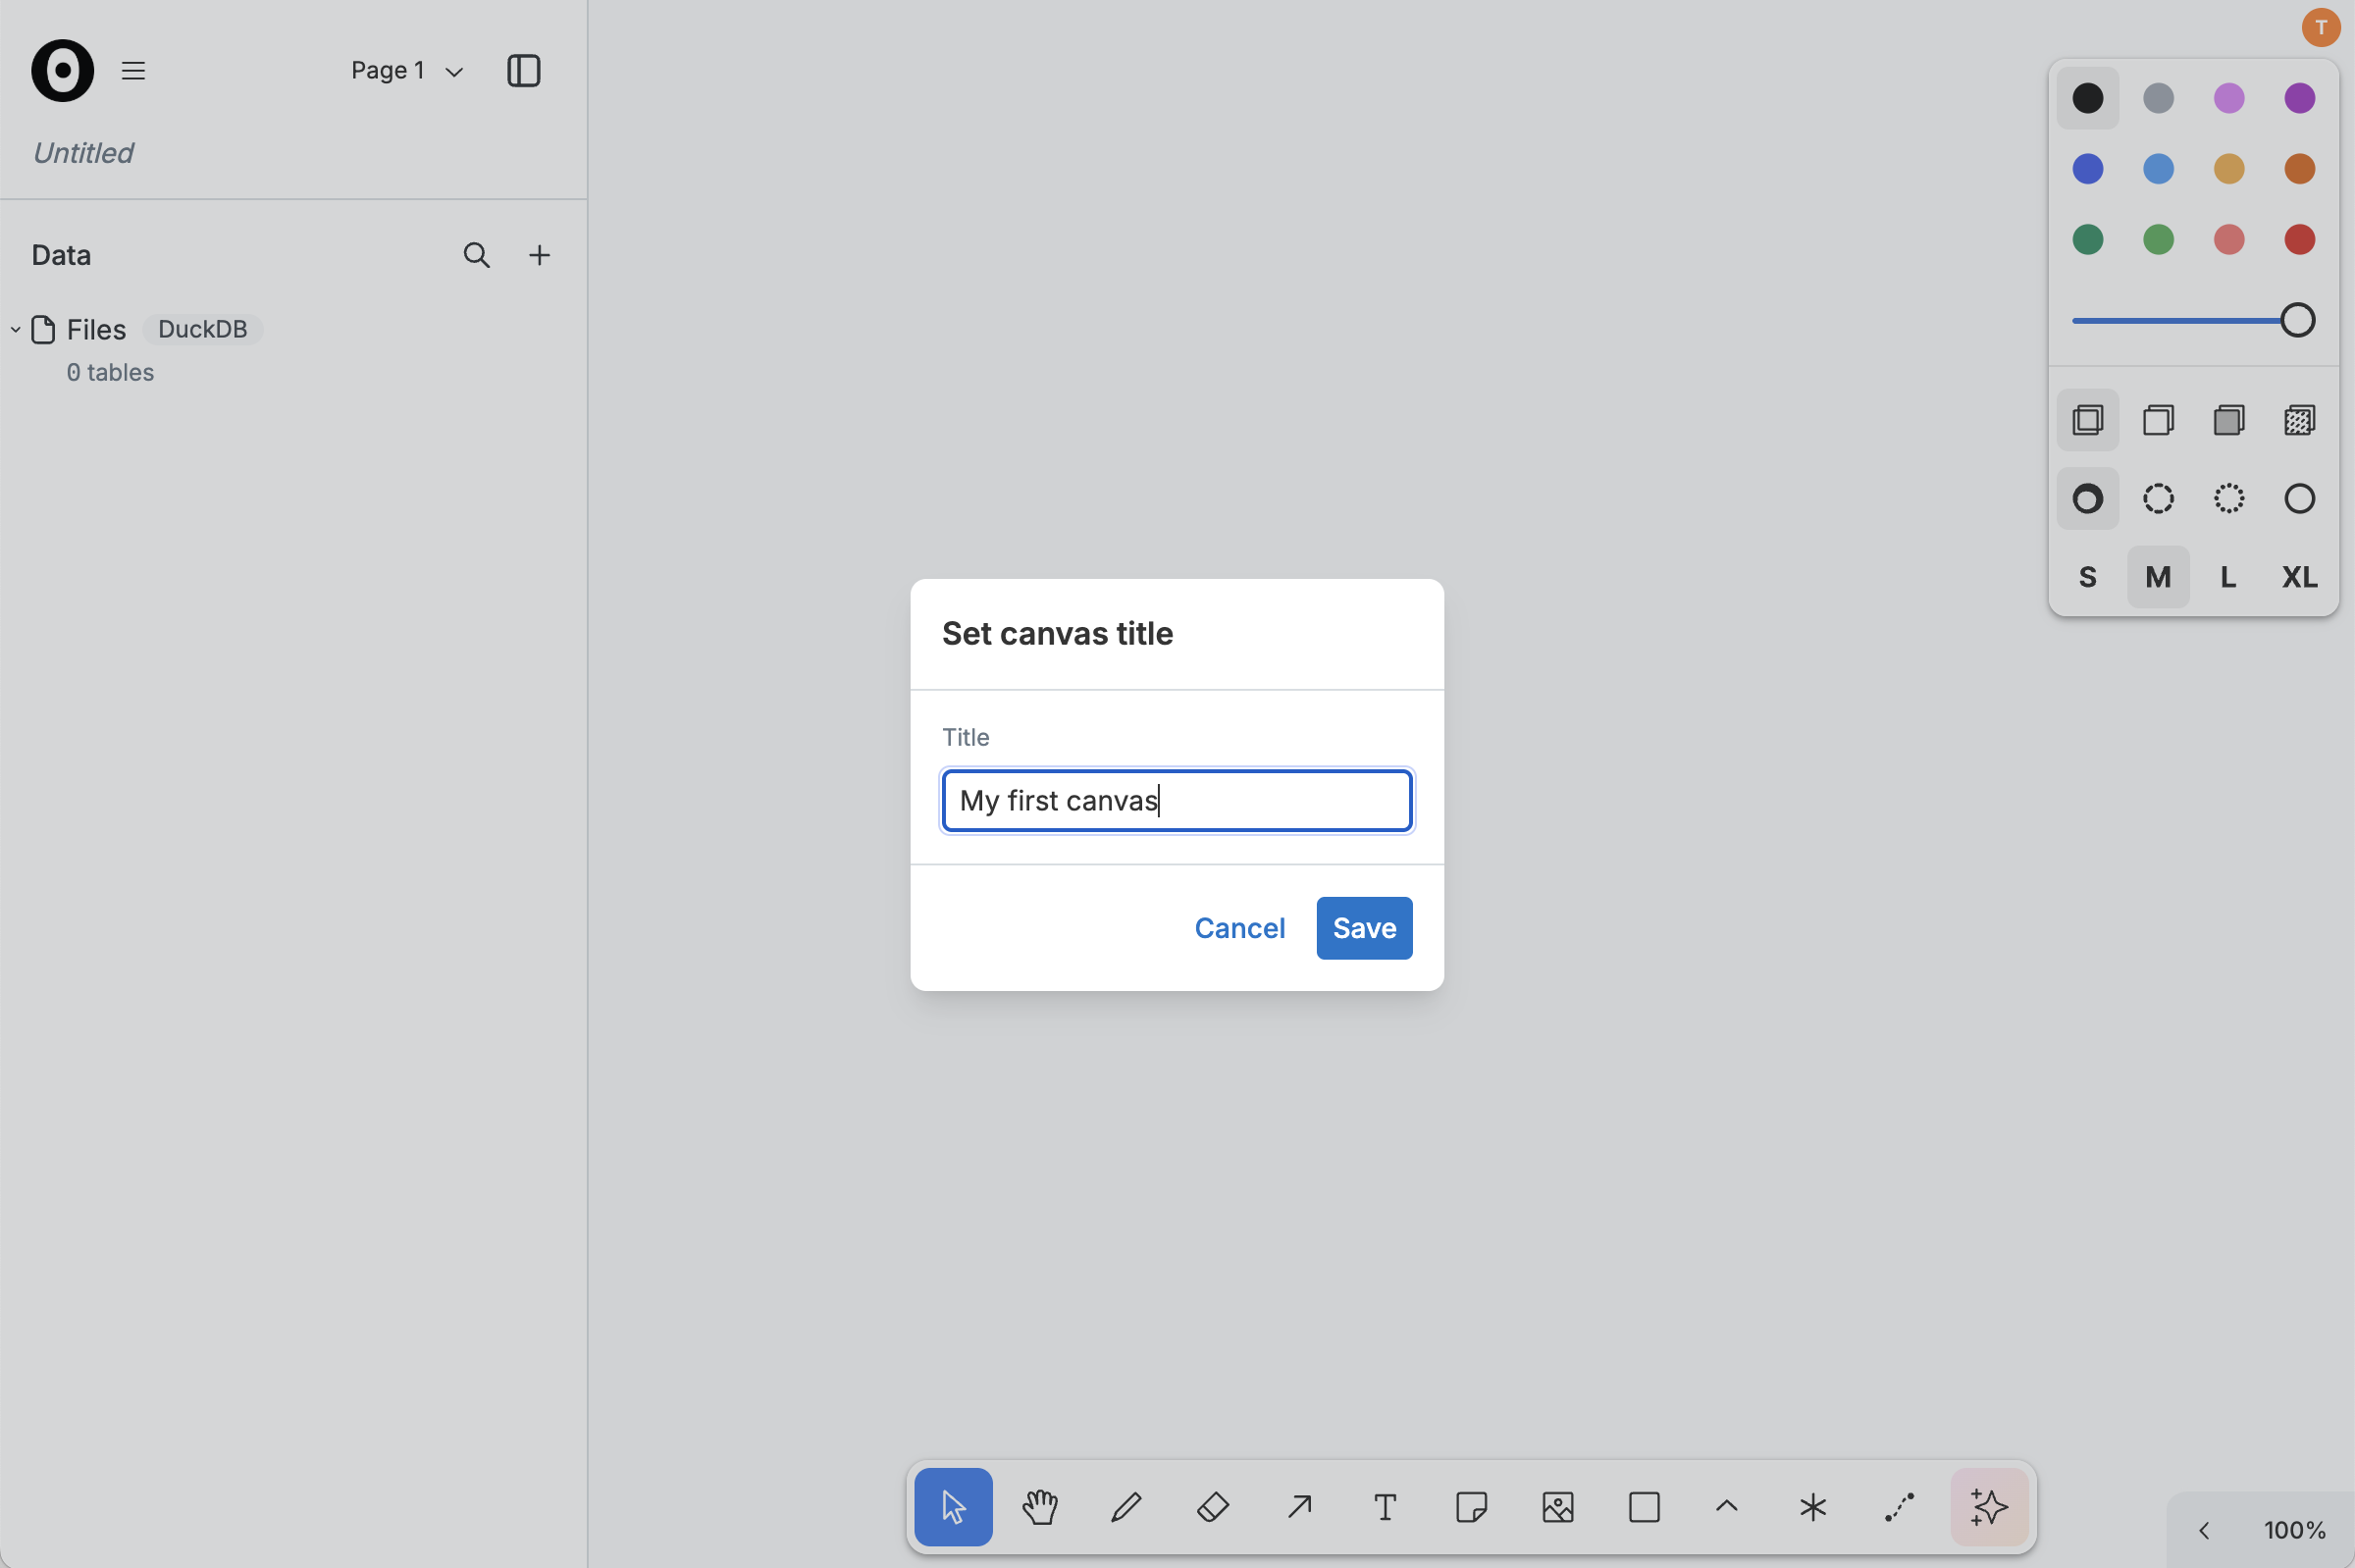
After entering a new title, click Save to apply it.
We’ll use a sample ecommerce dataset. Download these three files:
Add them to your canvas by clicking the + in the data panel on the left and selecting the three files to upload as data tables.
Once upload is complete, hover over the purchases table, which has 1.9M rows, and click the + on the right.
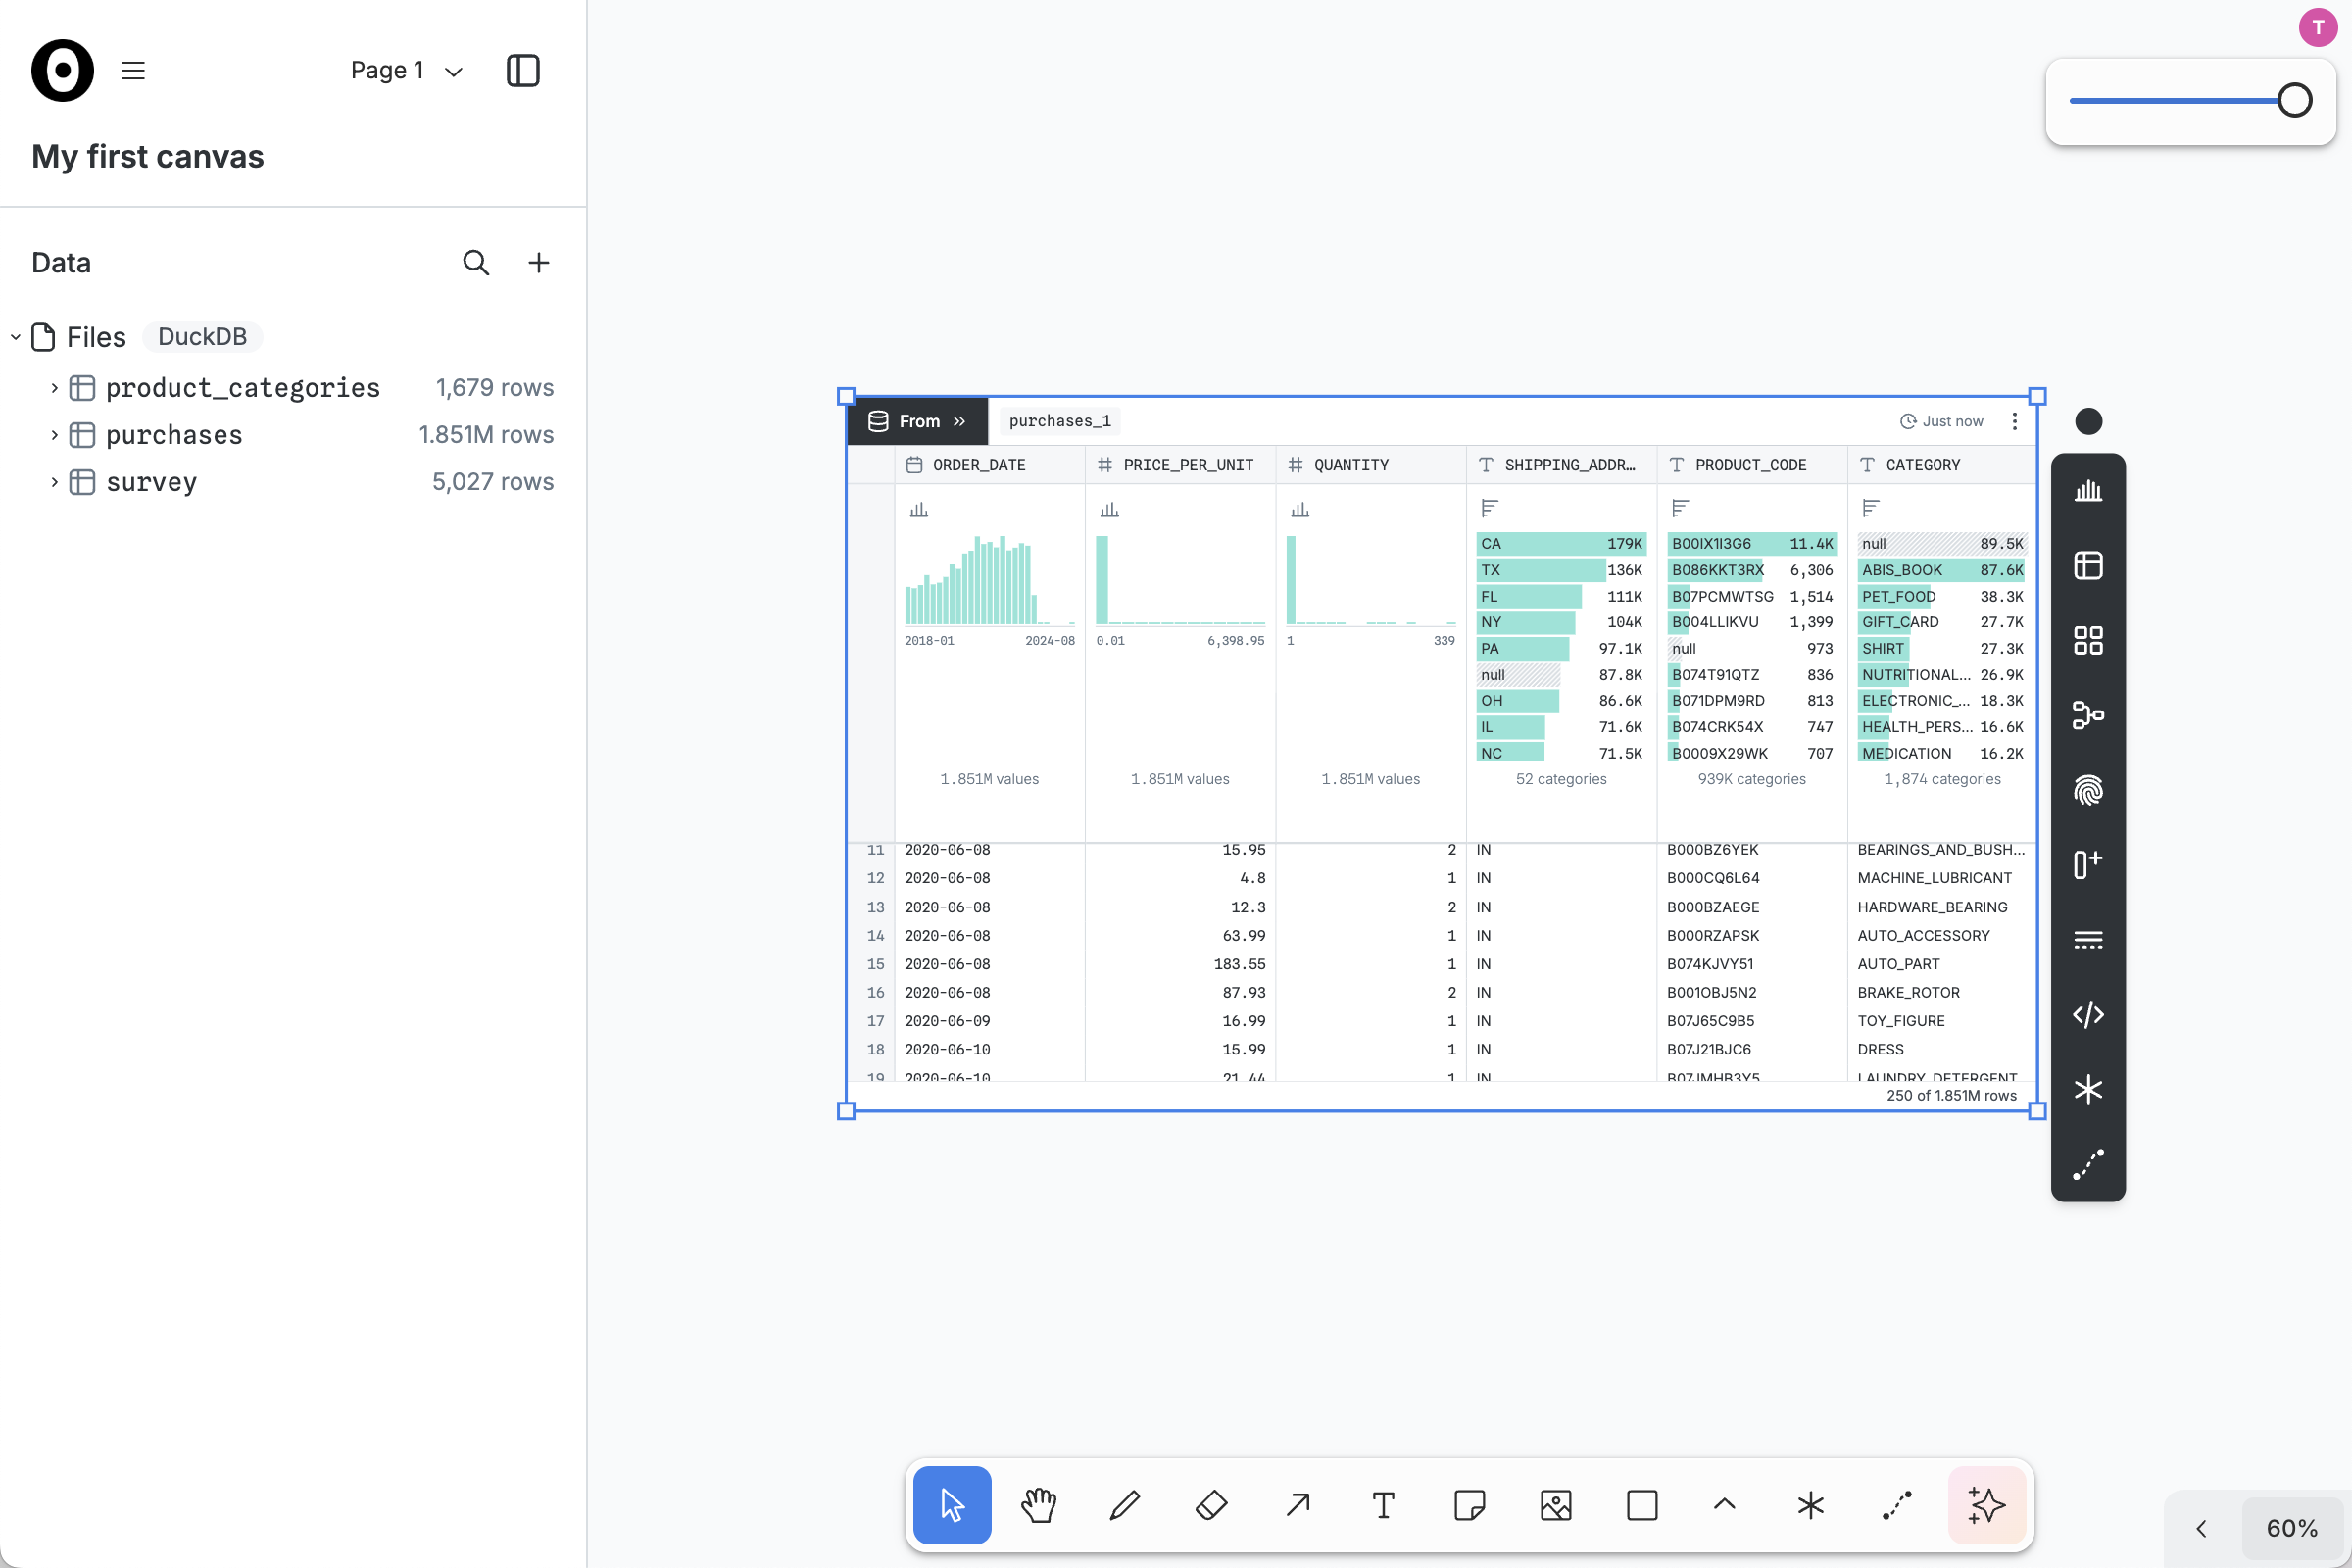
Double-click on the new From node to edit it, making it interactive; you should see a blue border and little boxes in the four corners. You can now scroll the table to inspect the rows and columns.
To create a chart node, pop out a column summary by clicking on the Create chart menu option in the column header dropdown. Below, we create a chart of the ORDER_DATE column, automatically showing the number of purchases per day over the entire dataset.
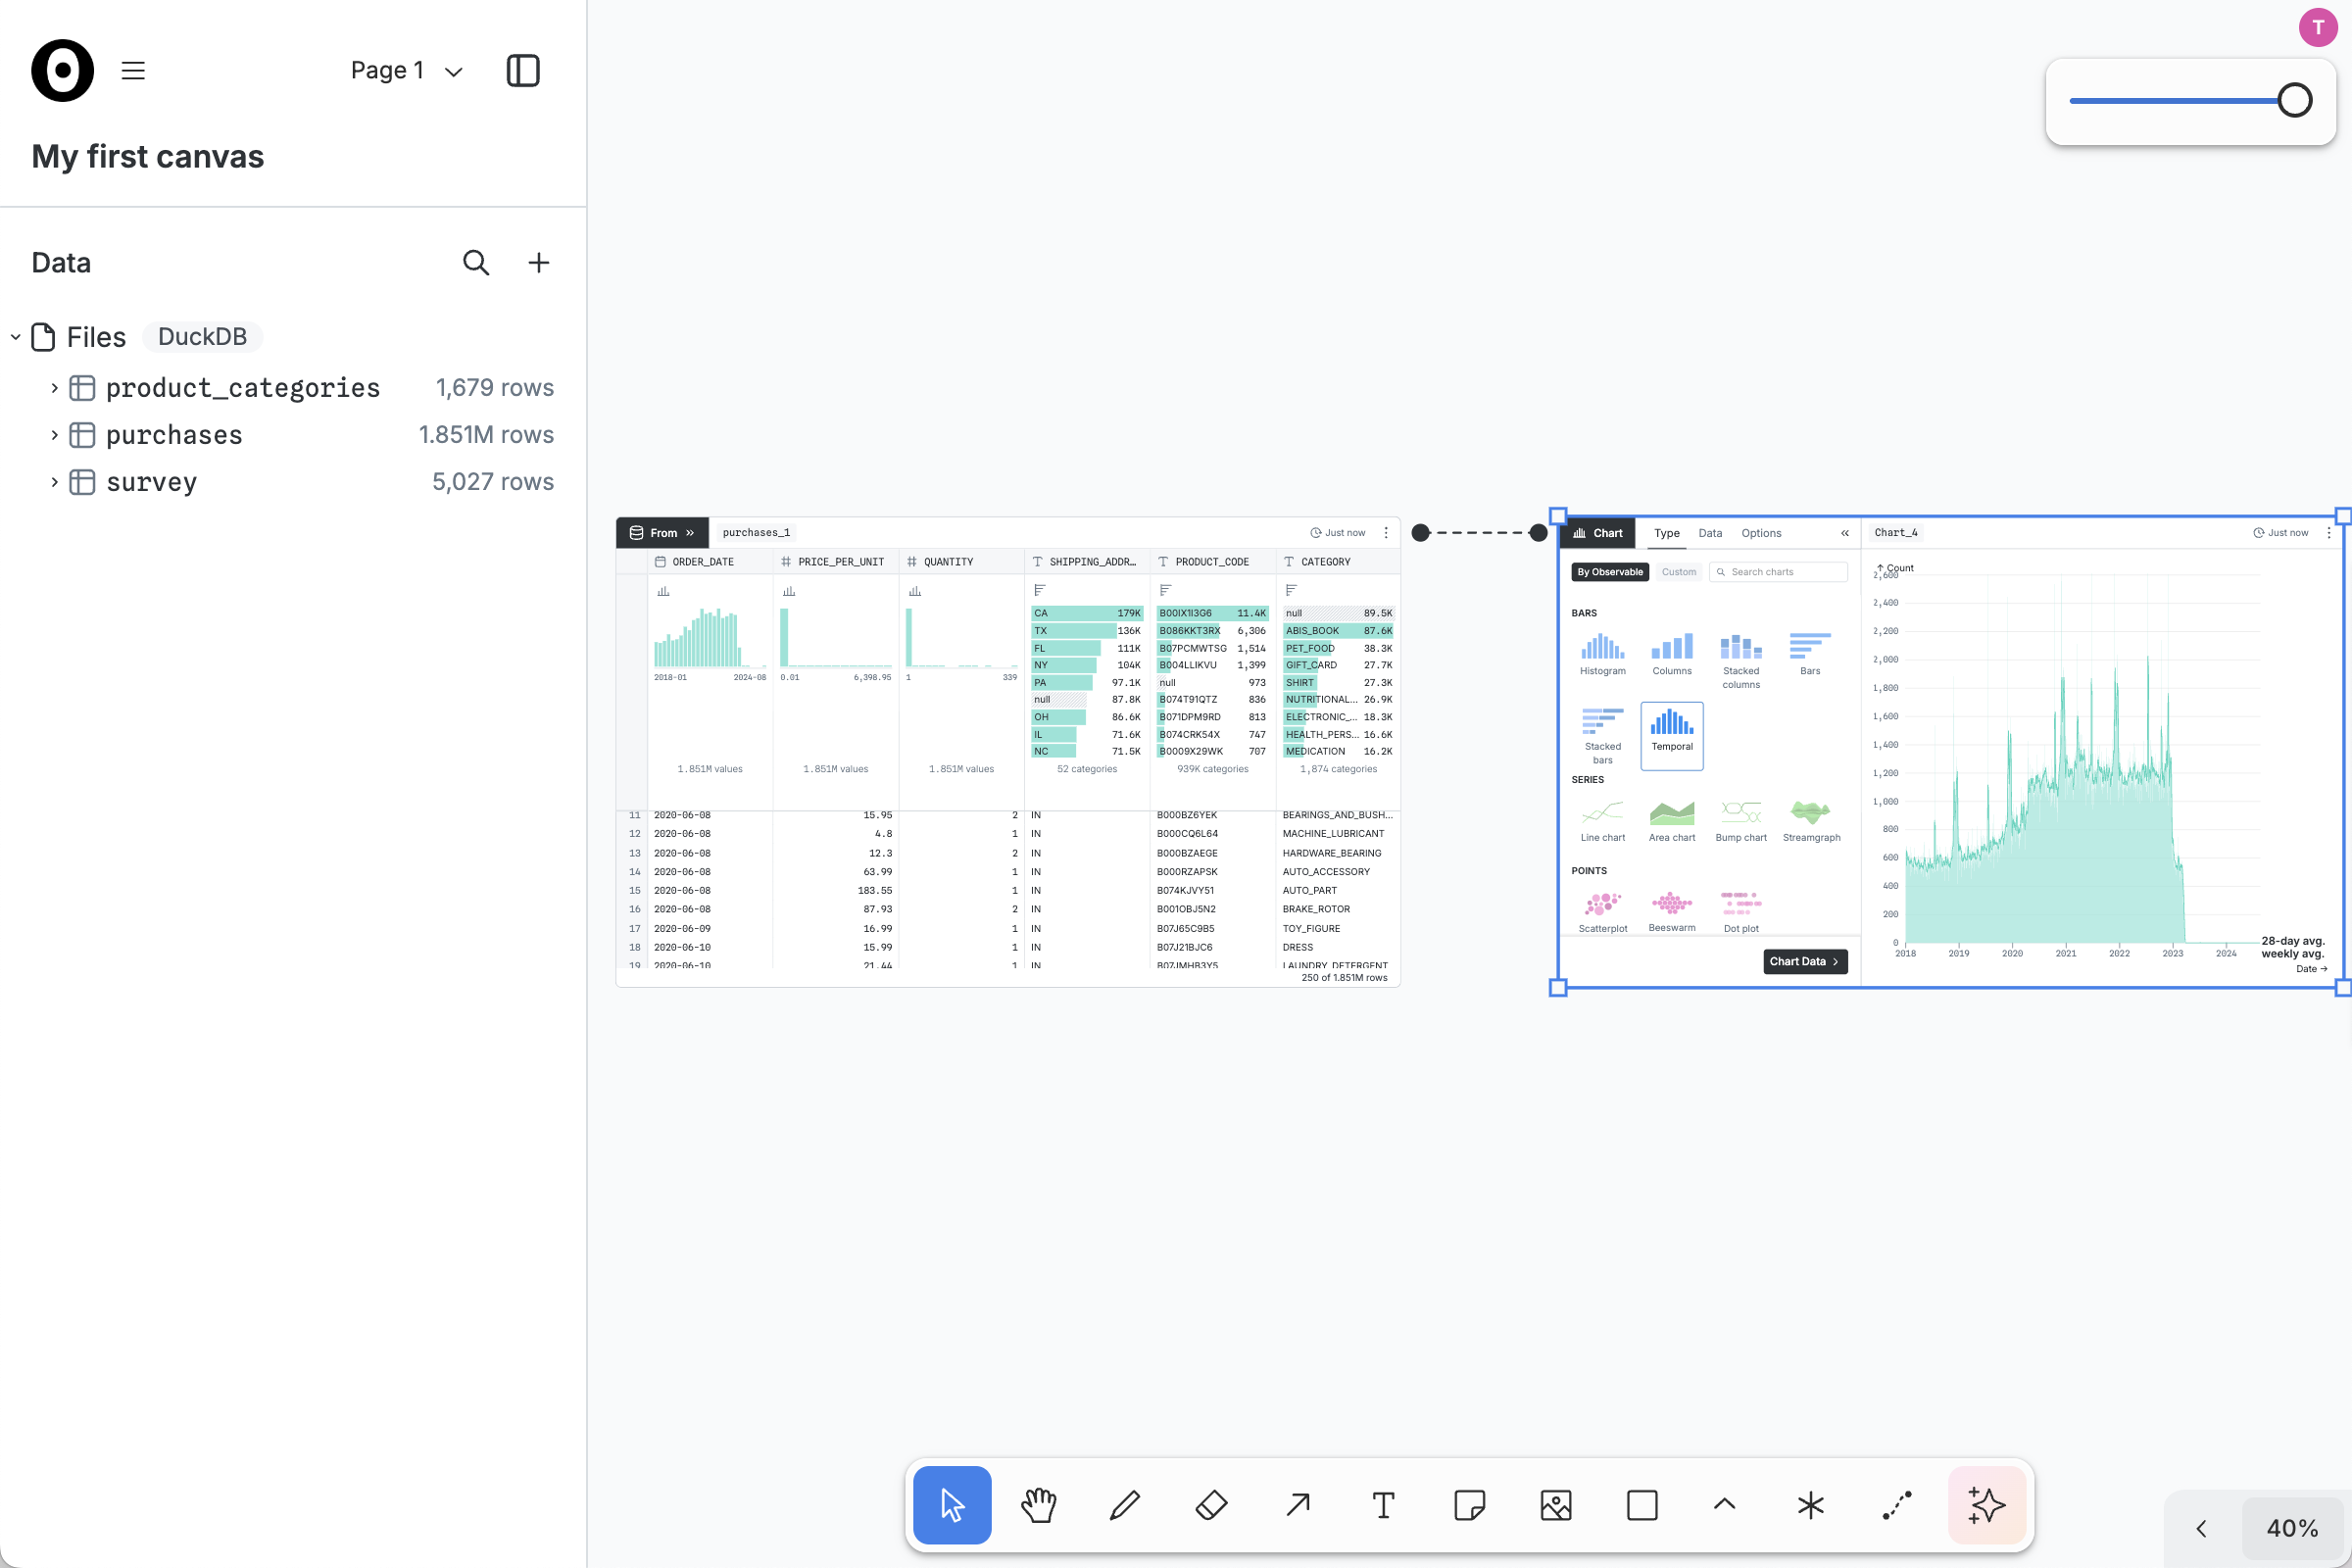
The new chart appears to the right of the upstream (here purchases_1) table. You can reposition the chart by clicking and dragging.
Back in the From node, click on another column summary to filter rows. For example, you can click on the ABIS_BOOK value in the CATEGORY column to show only book purchases.
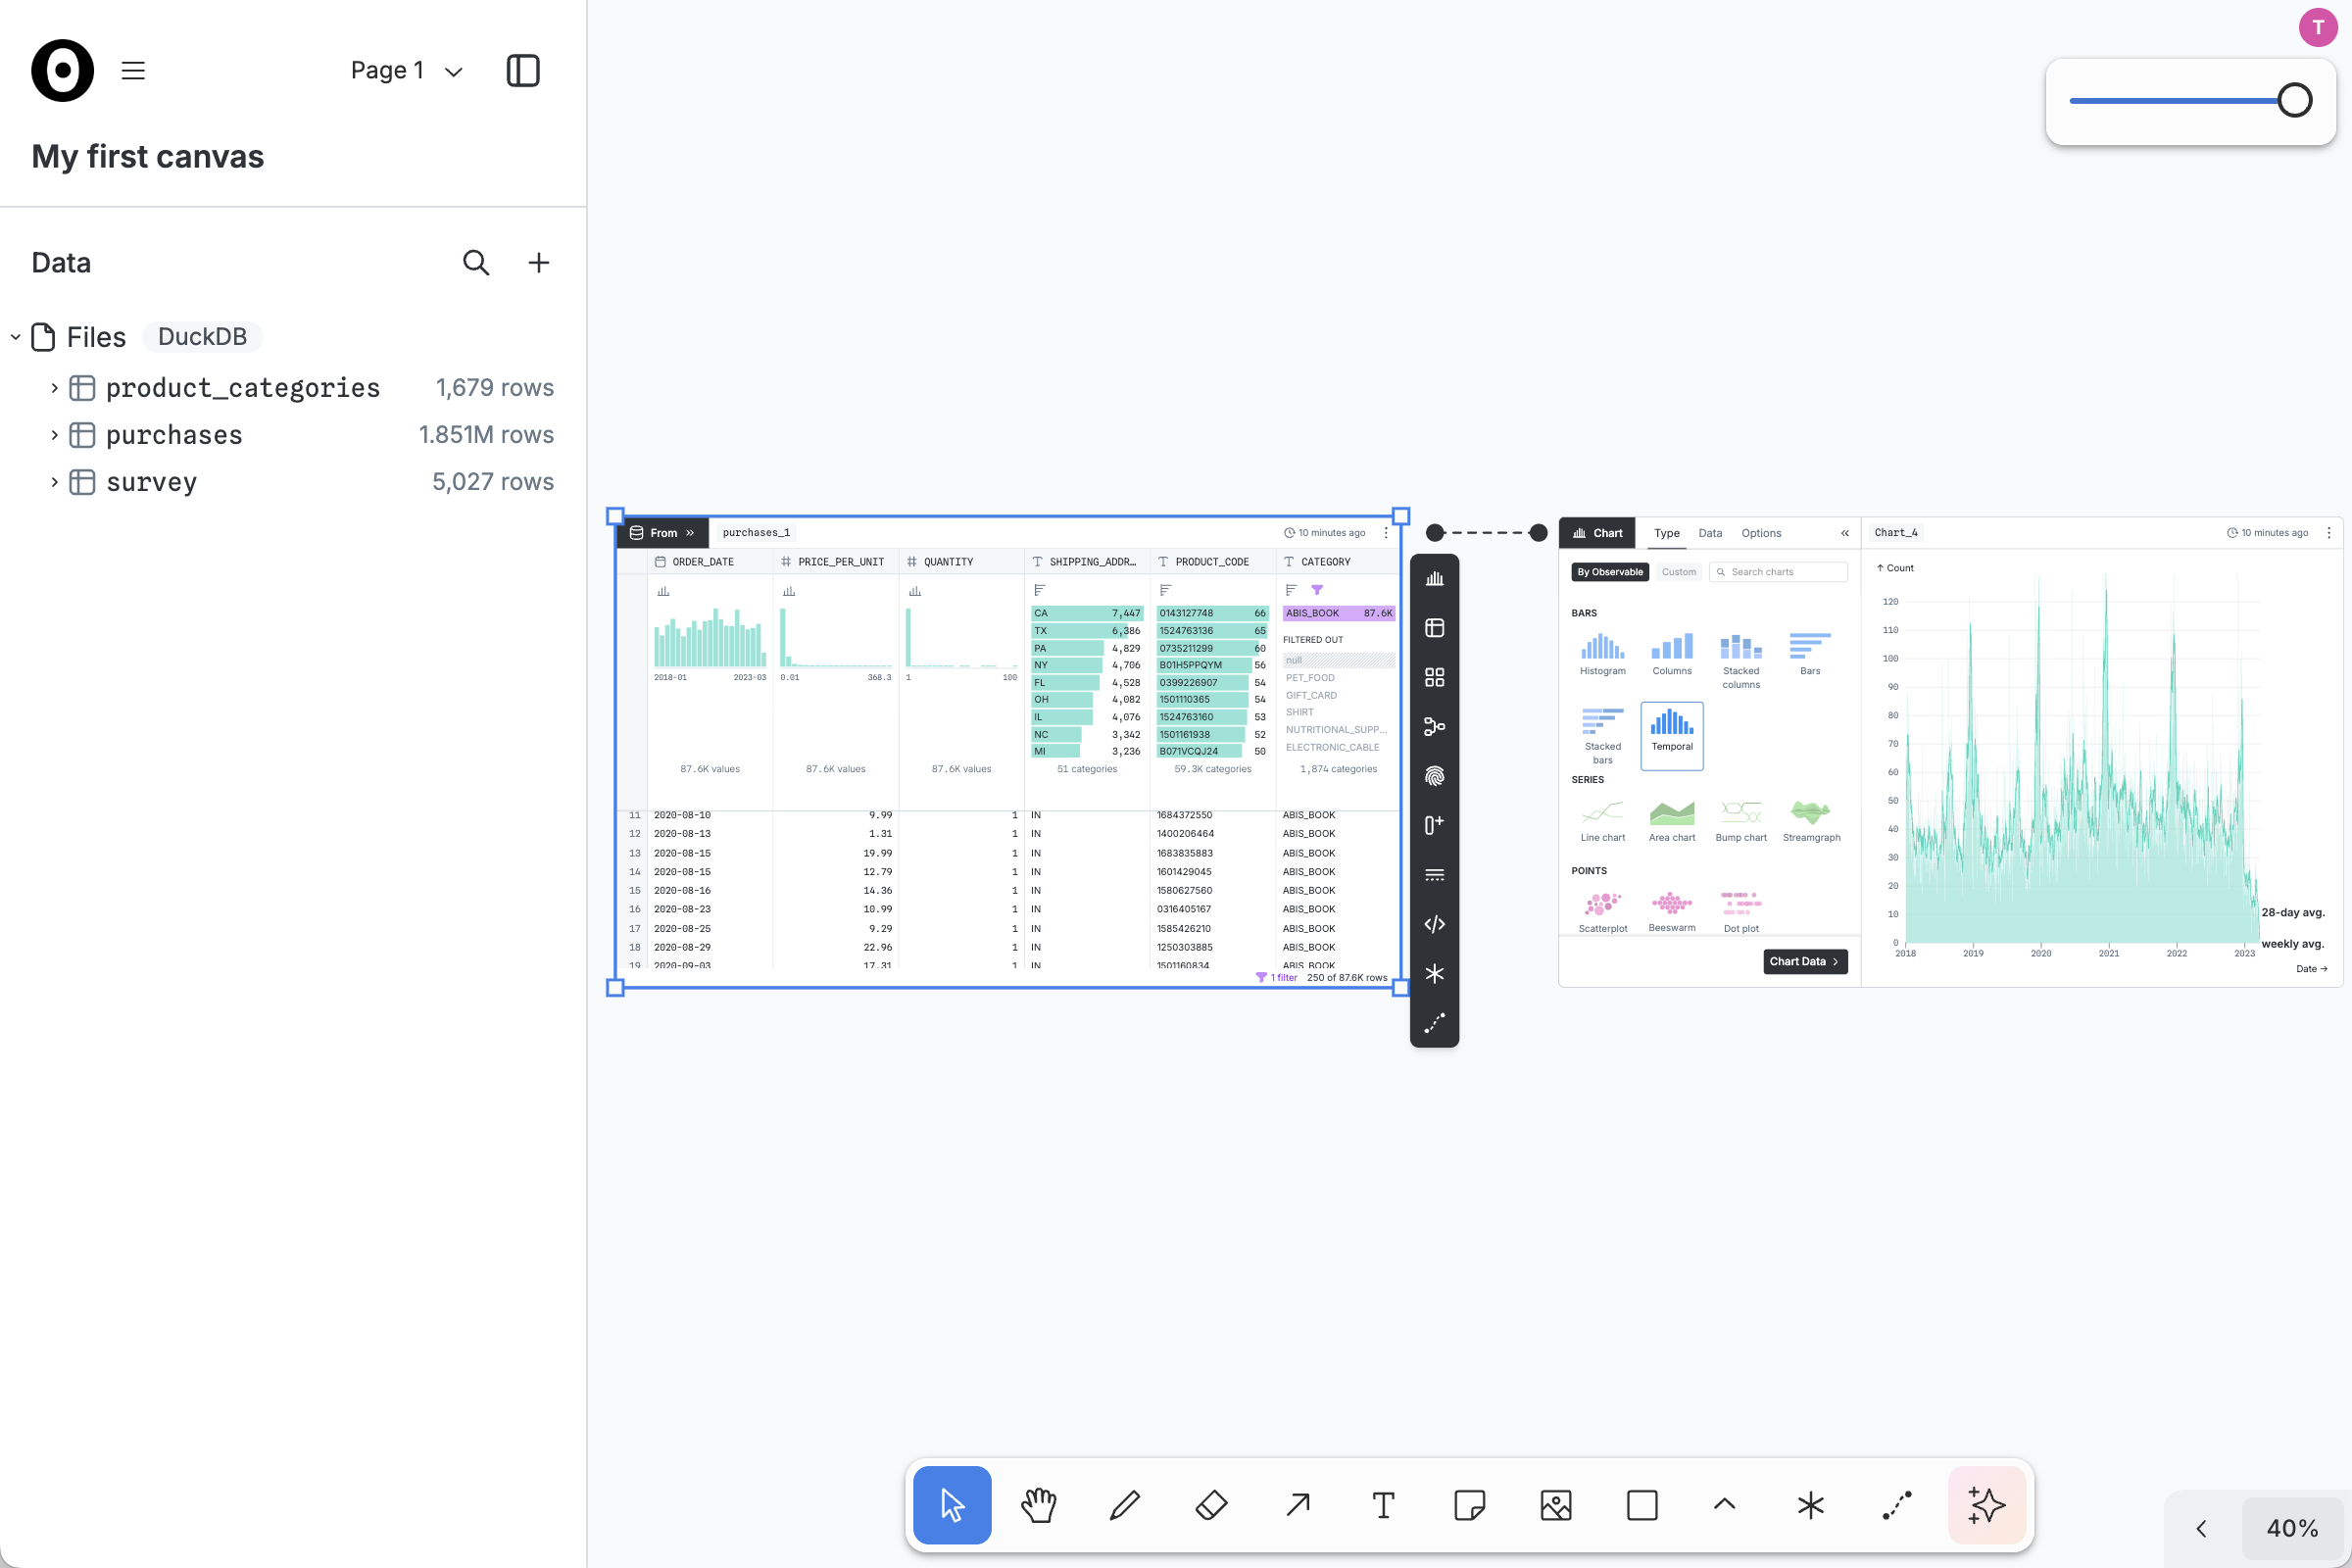
Notice now that the From node only shows 87.6K rows from the PURCHASES table rather than the full 1.9M. Notice also that the CATEGORY filter applies to the downstream chart by ORDER_DATE; this chart now shows only book purchases, not all purchases. (Book purchases spike every year for holiday gifts; this seasonal pattern was seemingly unaffected by the COVID-19 pandemic.)
Now pan to a blank area of the canvas. Click on on the toolbar to add a new SQL node, which will appear near the center of the viewport.
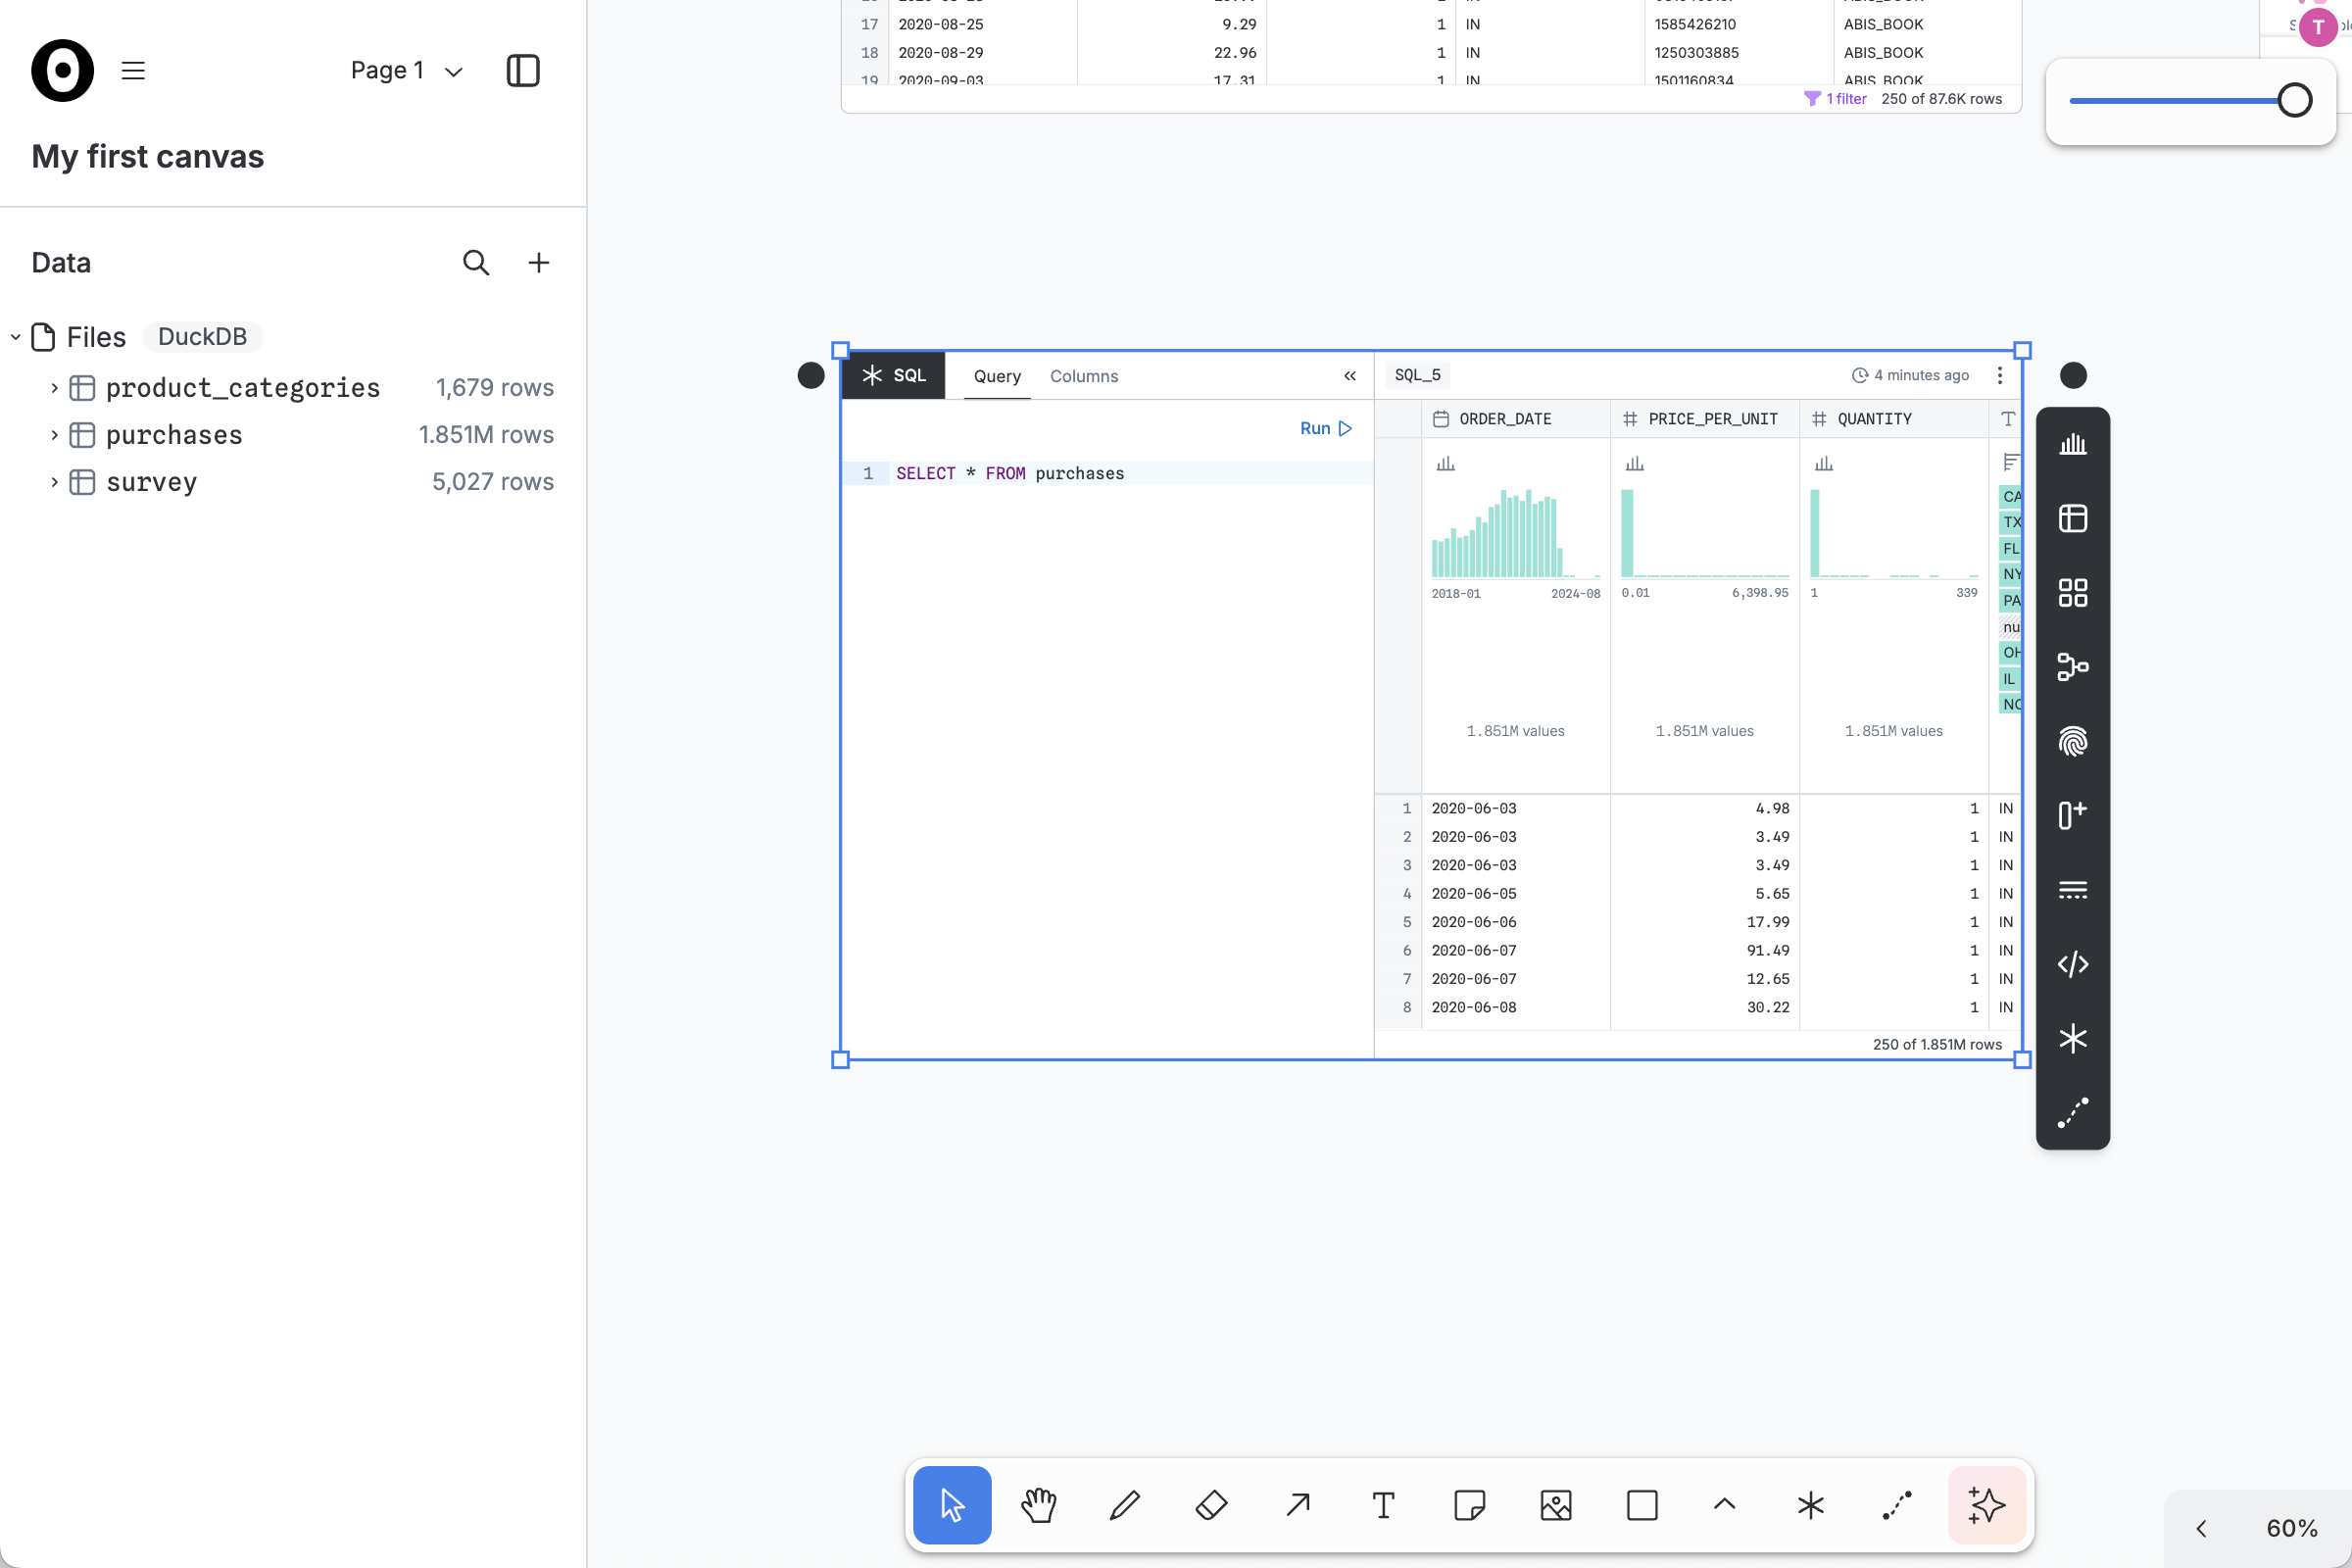
Try writing the following SQL:
SELECT * FROM purchasesThen click Run to run the query and review the results. This query should produce equivalent results to a From node for the purchases table, but now you can edit the SQL query as you like.
For next steps, try opening the AI toolbar and asking for suggestions!