Advanced embeds
NotebooksSo, you’ve written your magnum opus: a notebook full of splendor and delight. Maybe you’ve embedded it on your blog for all to see. Now, the problem is — How do you integrate its nifty charts into your web app? How do you save it to your hard drive, to file away for posterity alongside your old Word documents and vacation photos?
As you’ve probably noticed by now, Observable notebooks are a little different than the regular old JavaScripts you know and love. They execute in order of data flow rather than in a linear sequence of statements, and contain strange and marvelous reactive primitives, like viewof and mutable.
Luckily, Observable provides an open-source runtime which stitches together a notebook’s cells into a dependency graph and brings them to life through evaluation; a standard library, which provides helpful functions for working with HTML, SVG, generators, files and promises among other useful sundries; and an inspector, which implements the default strategy for rendering DOM and JavaScript values into a live web page — although you’re free to write your own.
Embed a cell
Previously, you saw how named cells from any published or shared notebook — a chart, a visualization, a widget — are quick and easy to embed.
Click Embed in the menu to the left of the cell below to open the Embed tool. The default Iframe method is fairly self-contained; this time, select Runtime with JavaScript from the dropdown so we can dive into it.
<svg width=100 height=100>
  <circle cx=40 cy=40 r=40 fill=green style="opacity: 0.25;" />
  <circle cx=50 cy=50 r=40 fill=red style="opacity: 0.25;" />
  <circle cx=60 cy=60 r=40 fill=blue style="opacity: 0.25;" />
</svg>
By default, the embed code loads the latest published version of the notebook. When you publish a new version of the notebook on Observable, your embedded cells will update immediately (or at least, within 30 seconds).
If you want to lock your embed code to a specific published version, you can add @version to your notebook’s ES module URL — and you can always find specific published versions in your notebook history.
Here’s a link to a plain web page that embeds the `graphic` cell above, from two different versions of this notebook, hosted off-site.
Notebooks as ES modules
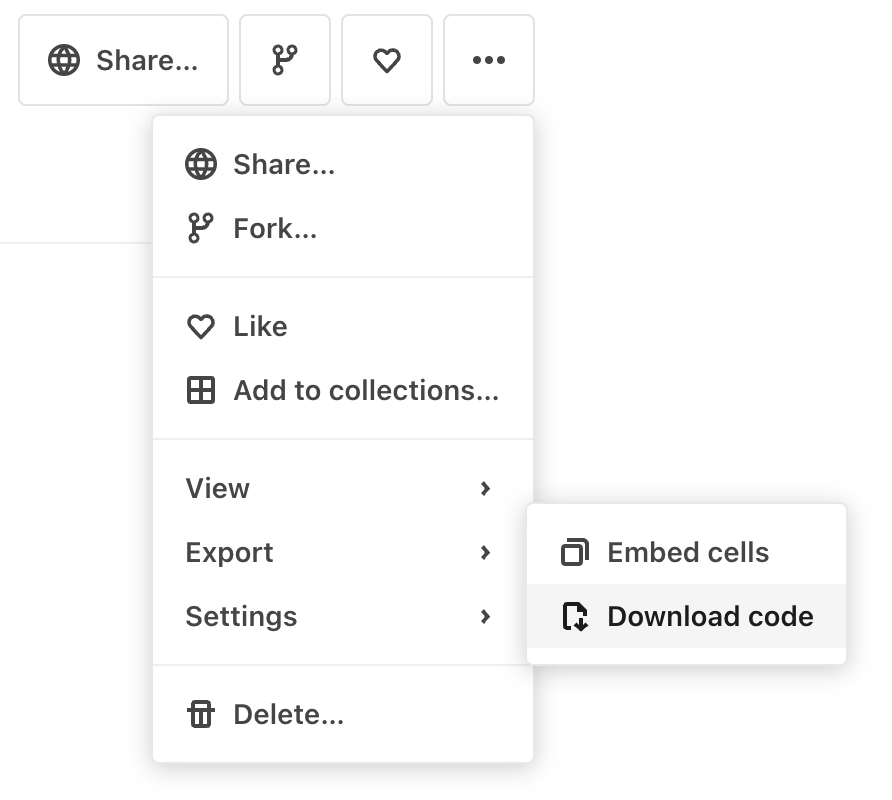
Your notebook can be compiled and downloaded as a JavaScript module! In the notebook menu, under Export, click Download code to download. This downloads your compiled notebook, including the Observable runtime, any imported notebooks, and an HTML template to demonstrate how to run your notebook.

Alternatively, you can hot link your code directly from Observable, as long as you’ve published your notebook or enabled link sharing:
https://api.observablehq.com/@jashkenas/my-neat-notebook.js?v=3You can use this module to run your notebook in any JavaScript environment. In this form, notebooks are true JavaScript programs that you can manipulate and integrate deeply with your application. Now let’s explore some ways to use embedded notebooks!
Rendering cells
The most obvious way to embed a notebook is to display its contents, live, in a web page. For this, the Observable runtime includes a standard inspector; it takes live values from the notebook and puts them into your HTML where you want them. For example, here’s an expanded view of the code the Embed tool gives you to render a notebook into an empty body:
<!DOCTYPE html>
<body>
<!-- Optional stylesheet -->
<link rel="stylesheet" href="https://cdn.jsdelivr.net/npm/@observablehq/inspector@5/dist/inspector.css">

<script type="module">
// Load the Observable runtime and inspector.
import {Runtime, Inspector} from "https://cdn.jsdelivr.net/npm/@observablehq/runtime@5/dist/runtime.js";
// Your notebook, compiled as an ES module.
import define from "https://api.observablehq.com/@jashkenas/my-neat-notebook.js?v=3";
// Load the notebook, observing its cells with a default Inspector
// that simply renders the value of each cell into the provided DOM node.
new Runtime().module(define, Inspector.into(document.body));
</script>
The code above includes an optional default stylesheet. To make your embedded notebook match your own website’s styles, you can replace that with your own, or use a CSS framework like Tachyons, or GitHub’s Primer.
If you don’t want to render the entire notebook, define a custom function to control which cells are rendered and where they go. For example, to render just the cell named “chart” into the DOM element with the same id, say:
new Runtime().module(define, name => {
  if (name === "chart") {
    return new Inspector(document.querySelector("#chart"));
  }
});
It’s important to note that when you render a limited set of cells from your notebook, the cells that aren’t used — or depended on by those that are — won’t be run at all!
Sometimes a cell that’s not referenced has important side effects, as in the Sortable Bar Chart, where an update cell passes data to the chart via a method that mutates the existing DOM element. If you want to run a cell with side effects in the background of your embedded notebook, you can return true instead of an inspector for those cells:
(new Runtime).module(define, name => {
  if (name === "chart") return Inspector.into(".chart")();
  if (name === "update") return true;
});
The code generated by the Embed tool uses this technique to run any cells that refer to one of the cells you’re embedding. If that’s over-eager, you can delete the line.
Note that CSS <style> cells don’t produce their side effects unless they are actually inserted into the DOM; they cannot be silently run in the background, and should instead be interpolated into a displayed HTML cell.
Reading cell values
While the standard inspector is useful for displaying notebooks as-is, either in whole or in part, Observable notebooks are true reactive programs that you can integrate deeply with vanilla JavaScript via observers.
An observer is an object that you define and implements optional methods to observe a cell’s live value. These methods are called repeatedly by the runtime as follows:
- observer.pending() immediately prior to each evaluation;
- observer.fulfilled(value) when evaluation finishes, passing the new value; and
- observer.rejected(error) if evaluation fails, passing the thrown error.
For example, here’s an observer that doesn’t touch the DOM, instead logging all evaluation to the console:
new Runtime().module(define, name => {
  return {
    pending() { console.log(`\${name} is running…`); },
    fulfilled(value) { console.log(name, value); },
    rejected(error) { console.error(error); }
  };
});
Below is an observer that listens to the “selection” cell, calling setSelection to do something with the new value (say, a React state hook). This technique could be used with a brushable scatterplot to drive your application with the selected data.
new Runtime().module(define, name => {
  switch (name) {
    case "viewof selection": return new Inspector(container);
    case "selection": return {fulfilled(value) { setSelection(value); }};
  }
});
Sometimes you just want the current value of a cell. For that, you don’t need a proper observer; instead, use module.value to get a promise to the current value of the cell with the given name.
const module = new Runtime().module(define);
const value = await module.value("chart");
document.querySelector("#chart").appendChild(value);
Overriding cell values
In addition to observing reactive values, your JavaScript program can assign reactive values, too, allowing bidirectional dataflow. For example, say you have a bar chart, and your application wants to update the displayed data dynamically. First, keep a reference to the main module for your notebook:
const main = new Runtime().module(define, name => {
  if (name === "chart") {
    return new Inspector(container);
  }
});
Then whenever you want to change the chart’s data, call module.redefine:
main.redefine("data", newData);Because Observable uses dataflow, the chart will update automatically in response to the new data, and the inspector will replace the contents of the chart’s container. You can pass module.redefine a constant value, a function that references other cell values—even a generator function that repeatedly yields values to produce an animation, if you want.
Another way to alter the behavior of your running notebook is to override Observable’s standard library. These built-in variables are provided to all notebooks. For example, for a fixed width of 640px instead of a responsive width, import Library, then re-assign the width value:
import {Runtime, Inspector, Library} from "https://cdn.jsdelivr.net/npm/@observablehq/runtime@5/dist/runtime.js";

const runtime = new Runtime(Object.assign(new Library, {width: 640}));
const main = runtime.module(define, …);
Notebooks as npm modules
The tarball you get when you click Download code is an installable npm module. If you right-click and copy the link, you’ll get something that looks like this:
https://api.observablehq.com/@jashkenas/my-neat-notebook.tgz?v=3Use this URL with npm or Yarn to install the latest version of your notebook in node_modules under its published name (@jashkenas/my-neat-notebook), along with a copy of the Observable runtime:
npm install @observablehq/runtime@5
npm install https://api.observablehq.com/@jashkenas/my-neat-notebook.tgz?v=3
Depending on your version of Node, you’ll either need to use Node’s --experimental-modules flag, esm, or your preferred bundler of choice. Note that the contents of this tarball may change over time (either because you republished your notebook, or because of internal changes to the compiled format). Thus, you may instead prefer to commit the source code contents of the download tarball into your repository rather than installing from node_modules.
Version pinning
To pin your notebook to a specific version, find the desired version number in the history and add it to the URL. Both the ES module and tarball formats support versioning. For example:
https://api.observablehq.com/@jashkenas/my-neat-notebook@42.js?v=3
https://api.observablehq.com/@jashkenas/my-neat-notebook@365.tgz?v=3
Demos
See our repository of examples for a reference set of basic techniques, or read about the runtime in the context of a React application.
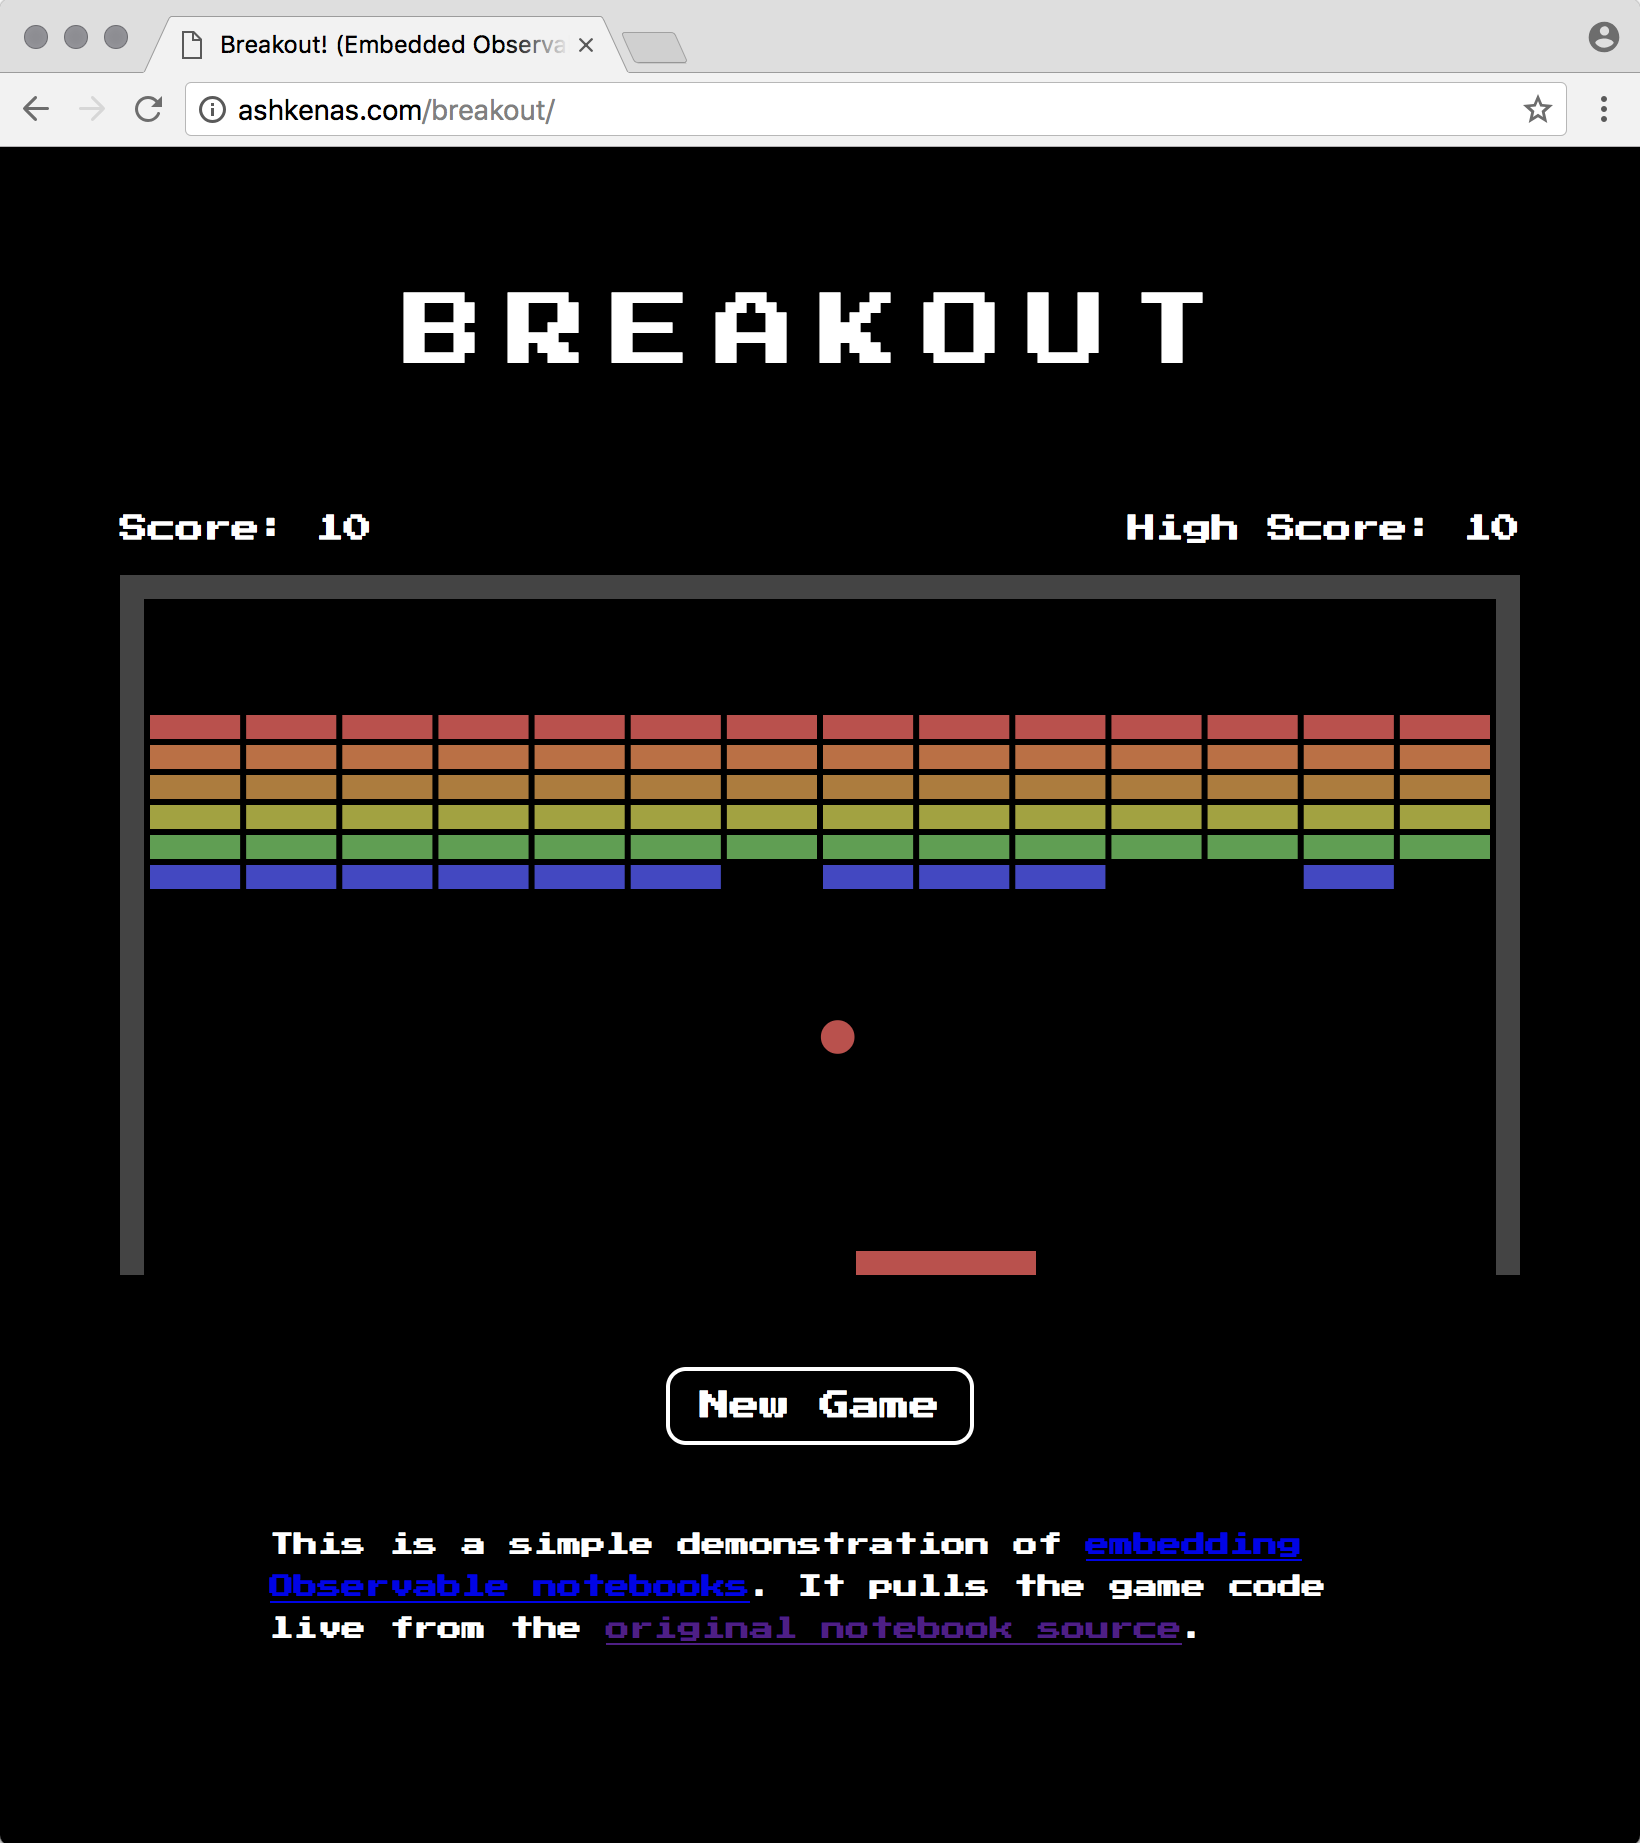
As an fun, off-site example of an embedded notebook in action, see Breakout! It runs this notebook, and uses the standard inspector to render the game canvas, the New Game button, the current score, and the high score.

This CodePen embeds a simple notebook that ticks once a second. Philippe Rivière wrote a brief tutorial that demonstrates embedding Tissot’s indicatrix into a blog. And as an arcane demonstration of the dark arts of recursive embedding, here is a notebook embedding itself!