

Notebooks
NotebooksObservable notebooks are interactive, editable documents defined by code. In notebooks, you can combine formatted text (in Markdown), code (JavaScript, SQL, HTML), and outputs (e.g. customized data tables and visualizations), then share your work with teammates and stakeholders.
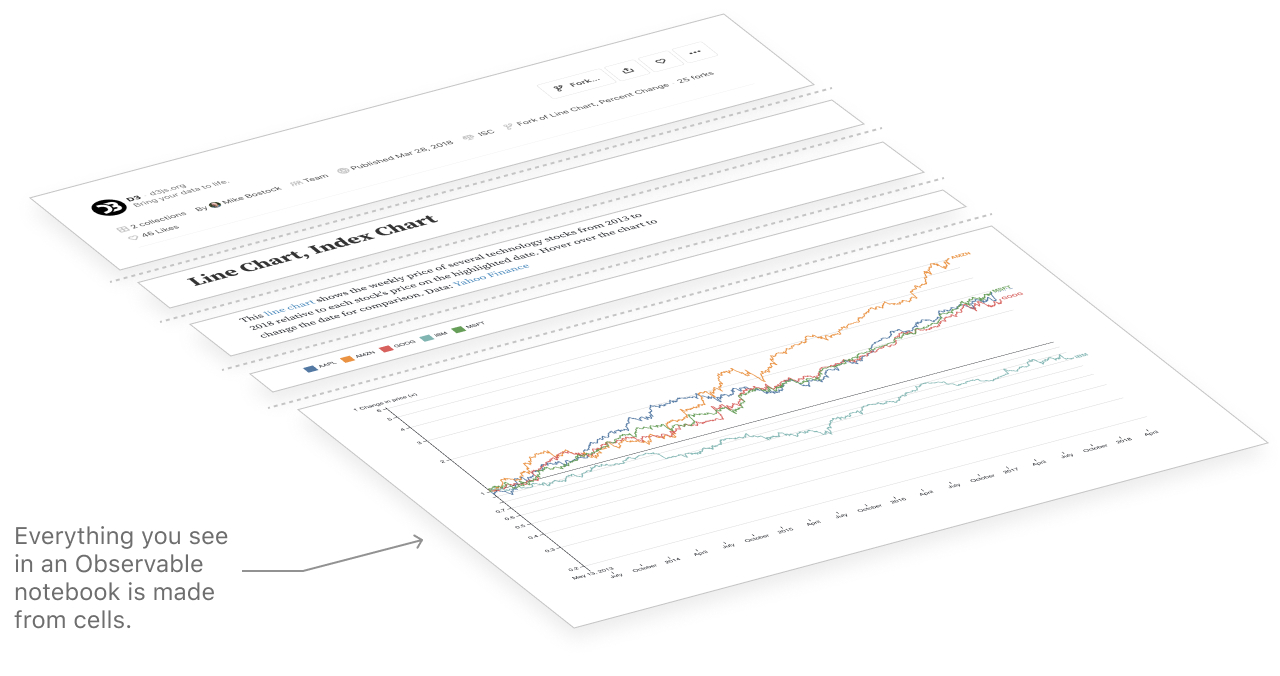
A notebook is both a final product for presentation, and a large blank canvas for trying out ideas and calculations. How do you start? By creating cells. Cells are where you place content — text, JavaScript code, or other instructions.
All content in notebooks is made in cells. Within cells, you can author formatted text (in Markdown) and code (JavaScript, SQL, HTML) to view right alongside customized data tables and visualizations. Then, quickly share your work with teammates and stakeholders to get everyone literally on the same page.
Upload data, visualize and add interactivity
Upload data
In Observable, you can quickly access your own data by attaching local files or spreadsheets, connecting to APIs, and—for Enterprise and Pro users—connecting to databases or cloud files. Here is an example of uploading a CSV file to an Observable notebook, and viewing its contents in a data table.
Visualize data with Plot
The Observable Plot library lets you quickly build and customize data visualizations. Code snippets are provided in the cell menu as a starting point for many common chart types. They help get you up and running quickly with your own visualizations by simply substituting your data and variable names.
Add interactivity
Observable Inputs are lightweight interface components (including buttons, sliders, dropdowns, tables, and text inputs) that help you explore data and build interactive displays. You can also find them in the cell menu.
Once you’ve added an Input to your notebook, link its value to one or more elements of a chart to add interactivity. Since your Observable notebook is on the web and in the language of the web, your interactive chart is immediately shareable with collaborators.
Collaboration
Multiplayer editing
You can invite others to join and edit notebooks with you. Edits are live and visible to all users who are present at the same time. You can see other active users’ avatars at the top of the screen. Click on them to automatically follow them around the notebook!
Explore, comment and discuss—right in the notebook
Collaborators and stakeholders don’t require edit access to contribute to work in an Observable notebook. Anyone with view access can interact with notebooks using inputs, and can give feedback and participate in discussions using comments. Comments get sent to the original editor so they can respond and resolve.
Version history
Whether working solo or with collaborators in a notebook, it is useful to have a record of changes made. The History pane (accessed by clicking the clock icon in the right margin) shows what changes were made to your notebook. You can also revert back to earlier versions at any time.
Automated version history in Observable means that everyone working in the notebook can safely make edits and investigate changes.
Collections
Collections are a way to organize notebooks into custom groups. Notebooks can be added to a single collection or many collections, and collections can be nested within other collections. You can view a users public notebooks as well as their public collections.
Forking
Creating a fork of a notebook means to make your own copy, like suddenly making a fork in the road and going your own way. This is a fundamental concept in software development, but if this idea is new to you, think of it as making a copy of a recipe. Once you have a copy, you can make changes without affecting the original—the forked copy of the recipe is yours to save, modify, or discard as you choose.
History
Observable keeps a history of all edits made to a notebook, allowing you to undo (and redo) changes whenever needed. Notebook history lets authors edit fearlessly with the knowledge that they can always go back to a previous version of their notebook. It also allows teams to better understand how their notebooks have changed over time, and who edited them.
Imports
Observable lets you quickly reuse content by importing named cells from other notebooks. Most often you’ll import code and functions for reuse, but imports are versatile — you can also import charts, inputs, tables, or text from any named cell. This works with community notebooks, as well as private notebooks within a team. You must have access to a notebook to be able import its cells.
Saving
As Observable keeps a history of all yoru edits to a notebook, it’s helpful to understand how saving works with notebooks. Some edits, like in tinker mode, do not trigger a save to the original notebook.
Templates
In addition to forking and importing from notebooks, the Observable team has published dozens of notebook templates to help you get started with common analyses and visualizations. When you create a new notebook, you’ll see these templates as boilerplate options. Selecting a template will automatically fork a copy of the template notebook to your space.