

Cells
NotebooksAll of Observable notebooks are made of cells. To build a notebook is to add cells to a notebook.
Cells can be added in a few different ways in Observable.
Add cell menu
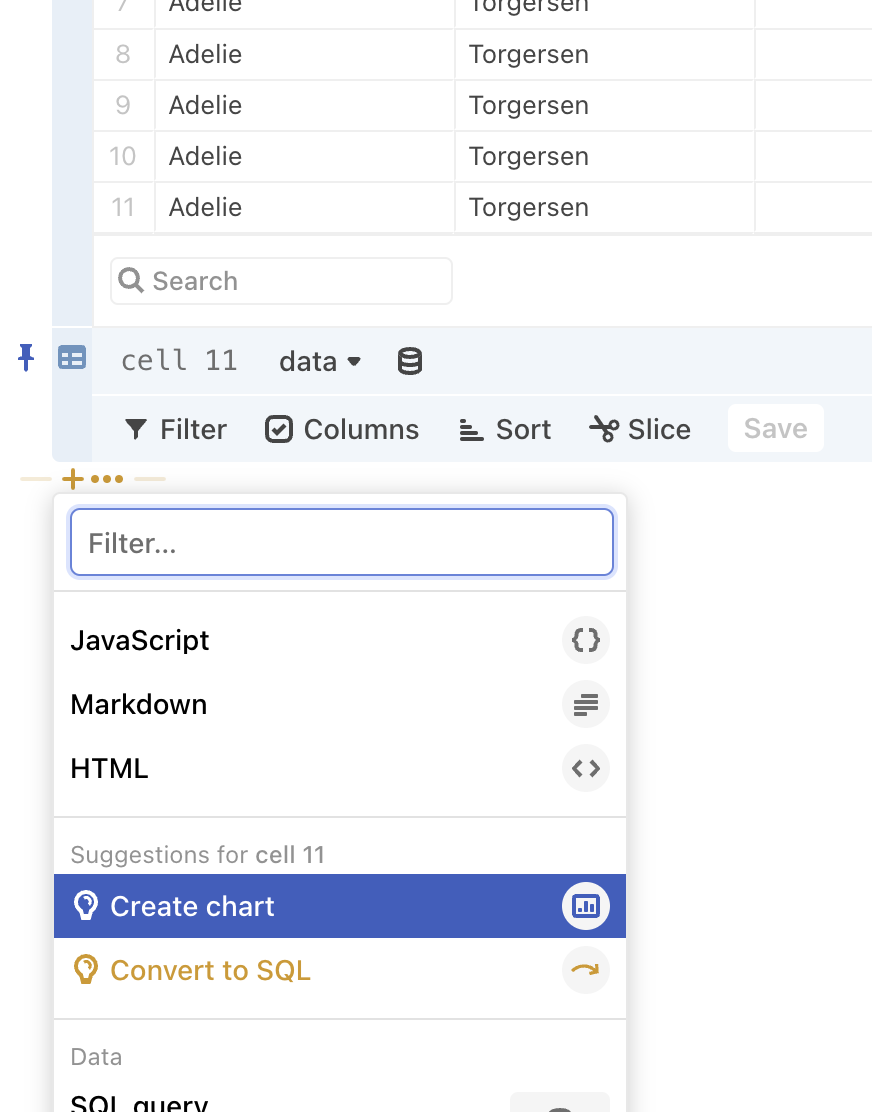
To add a cell, click the + button on the left above or below any cell to open the add cell menu.
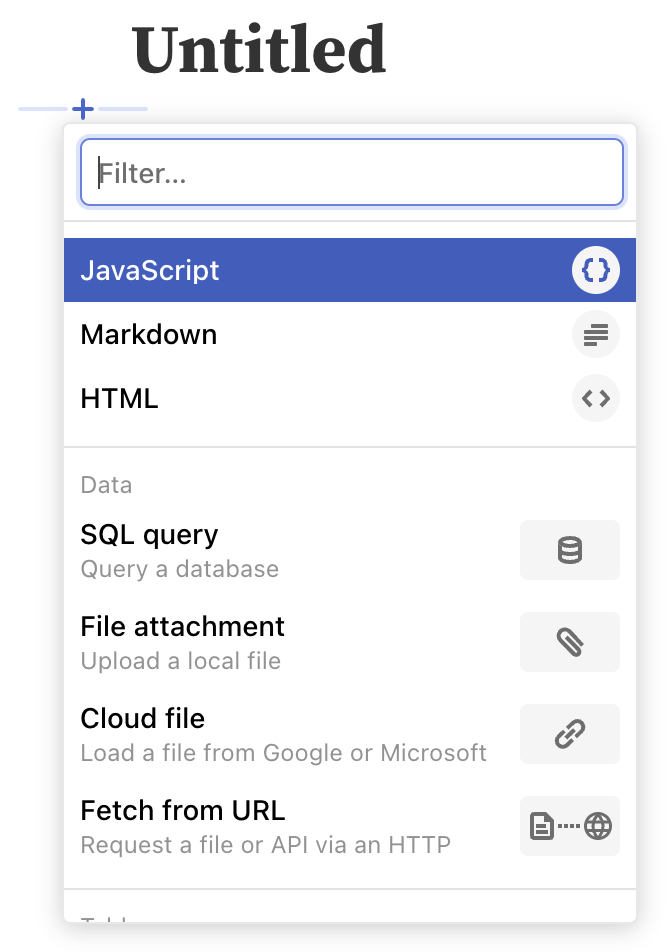
The most basic cell modes are JavaScript, Markdown, and HTML. The rest of the menu is divided into sections:
- Data: add a SQL query, file attachment, etc.
- Tables: display and transform data in tables
- Plot: add Observable Plot snippets, from bars to box plots
- Maps: visualize geographical data
- Trees and Networks: show connections among nodes of a graph
- Inputs: add controls like sliders and checkboxes
- Text: add headings, lists, and images
- Graphics: add custom D3, SVG, or Canvas
- Notifications: send messages to Slack or email
- Sample data: get started with convenient examples
- Imports: import from notebooks or npm
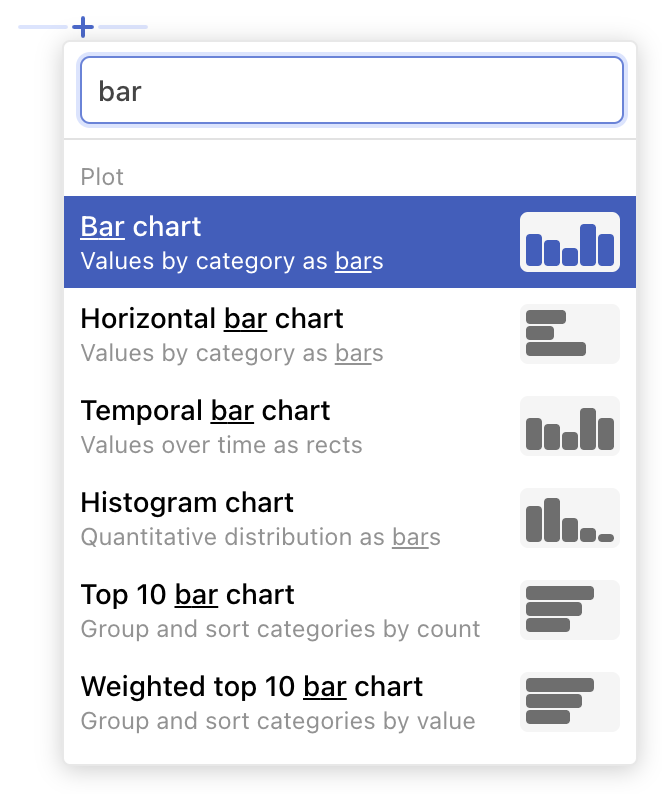
Filtering the menu
Type to filter the menu to matching items insert the corresponding type of cell into your notebook.
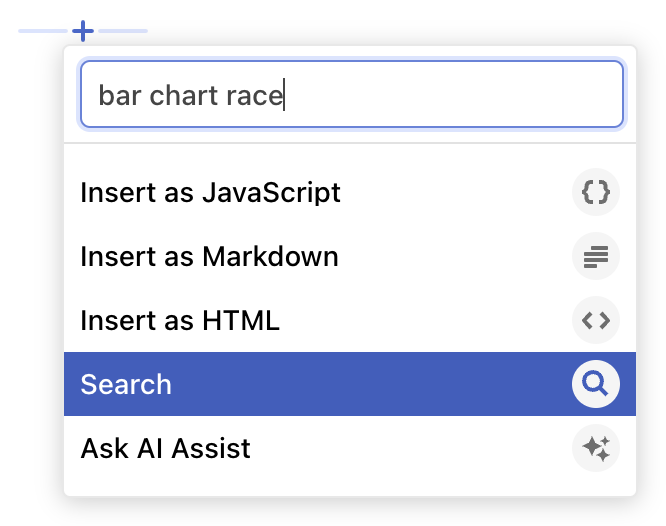
If your filter does not match any known menu items, you can insert what you typed as a cell, search all of Observable for the term, or ask AI Assist.
Cell suggestions
The add cell menu will sometimes light up gold with contextual options to add a cell based on the cell above. Tabular data can be made into a table or chart; no-code data table cells can be converted to SQL code; and no-code chart cells can be converted to JavaScript code.
Evaluating cells
To run a cell, click the Play button or press Shift-Enter . This updates the display of the cell above the editor, and runs any other cells that depend on it. The play button appears outlined if there are no changes to run, and filled-in if there are. Cells are implicitly run when you blur an editor, e.g. by pressing Escape .
Naming cells
Naming cells allows you to refer to the cell elsewhere in a notebook, or import it to another notebook.
Name a JavaScript cell in one of four ways:
- Name a cell expression:
expressionName = 8- Name a block:
blockName = {
  return 80;
}- Name a function declaration:
function functionName() {
  return 800;
}- Name a class:
class className {}Name a Markdown cell by entering the name of the cell in the following area (visible at the bottom of your browser window when you are editing the cell):

For specialty cells like the Data Table, SQL and Chart cell, you can either edit the cell name from the menu in the bottom of the browser as shown above, or you can update the cell name in the top left of the cell:
