

Canvases
Observable Canvases are collaborative whiteboards for exploring, visualizing, and analyzing data. By combining queries, tables, charts, freehand drawing, highlighting, notes, and more, canvases capture and communicate context and help everyone on your team to engage with data analysis.
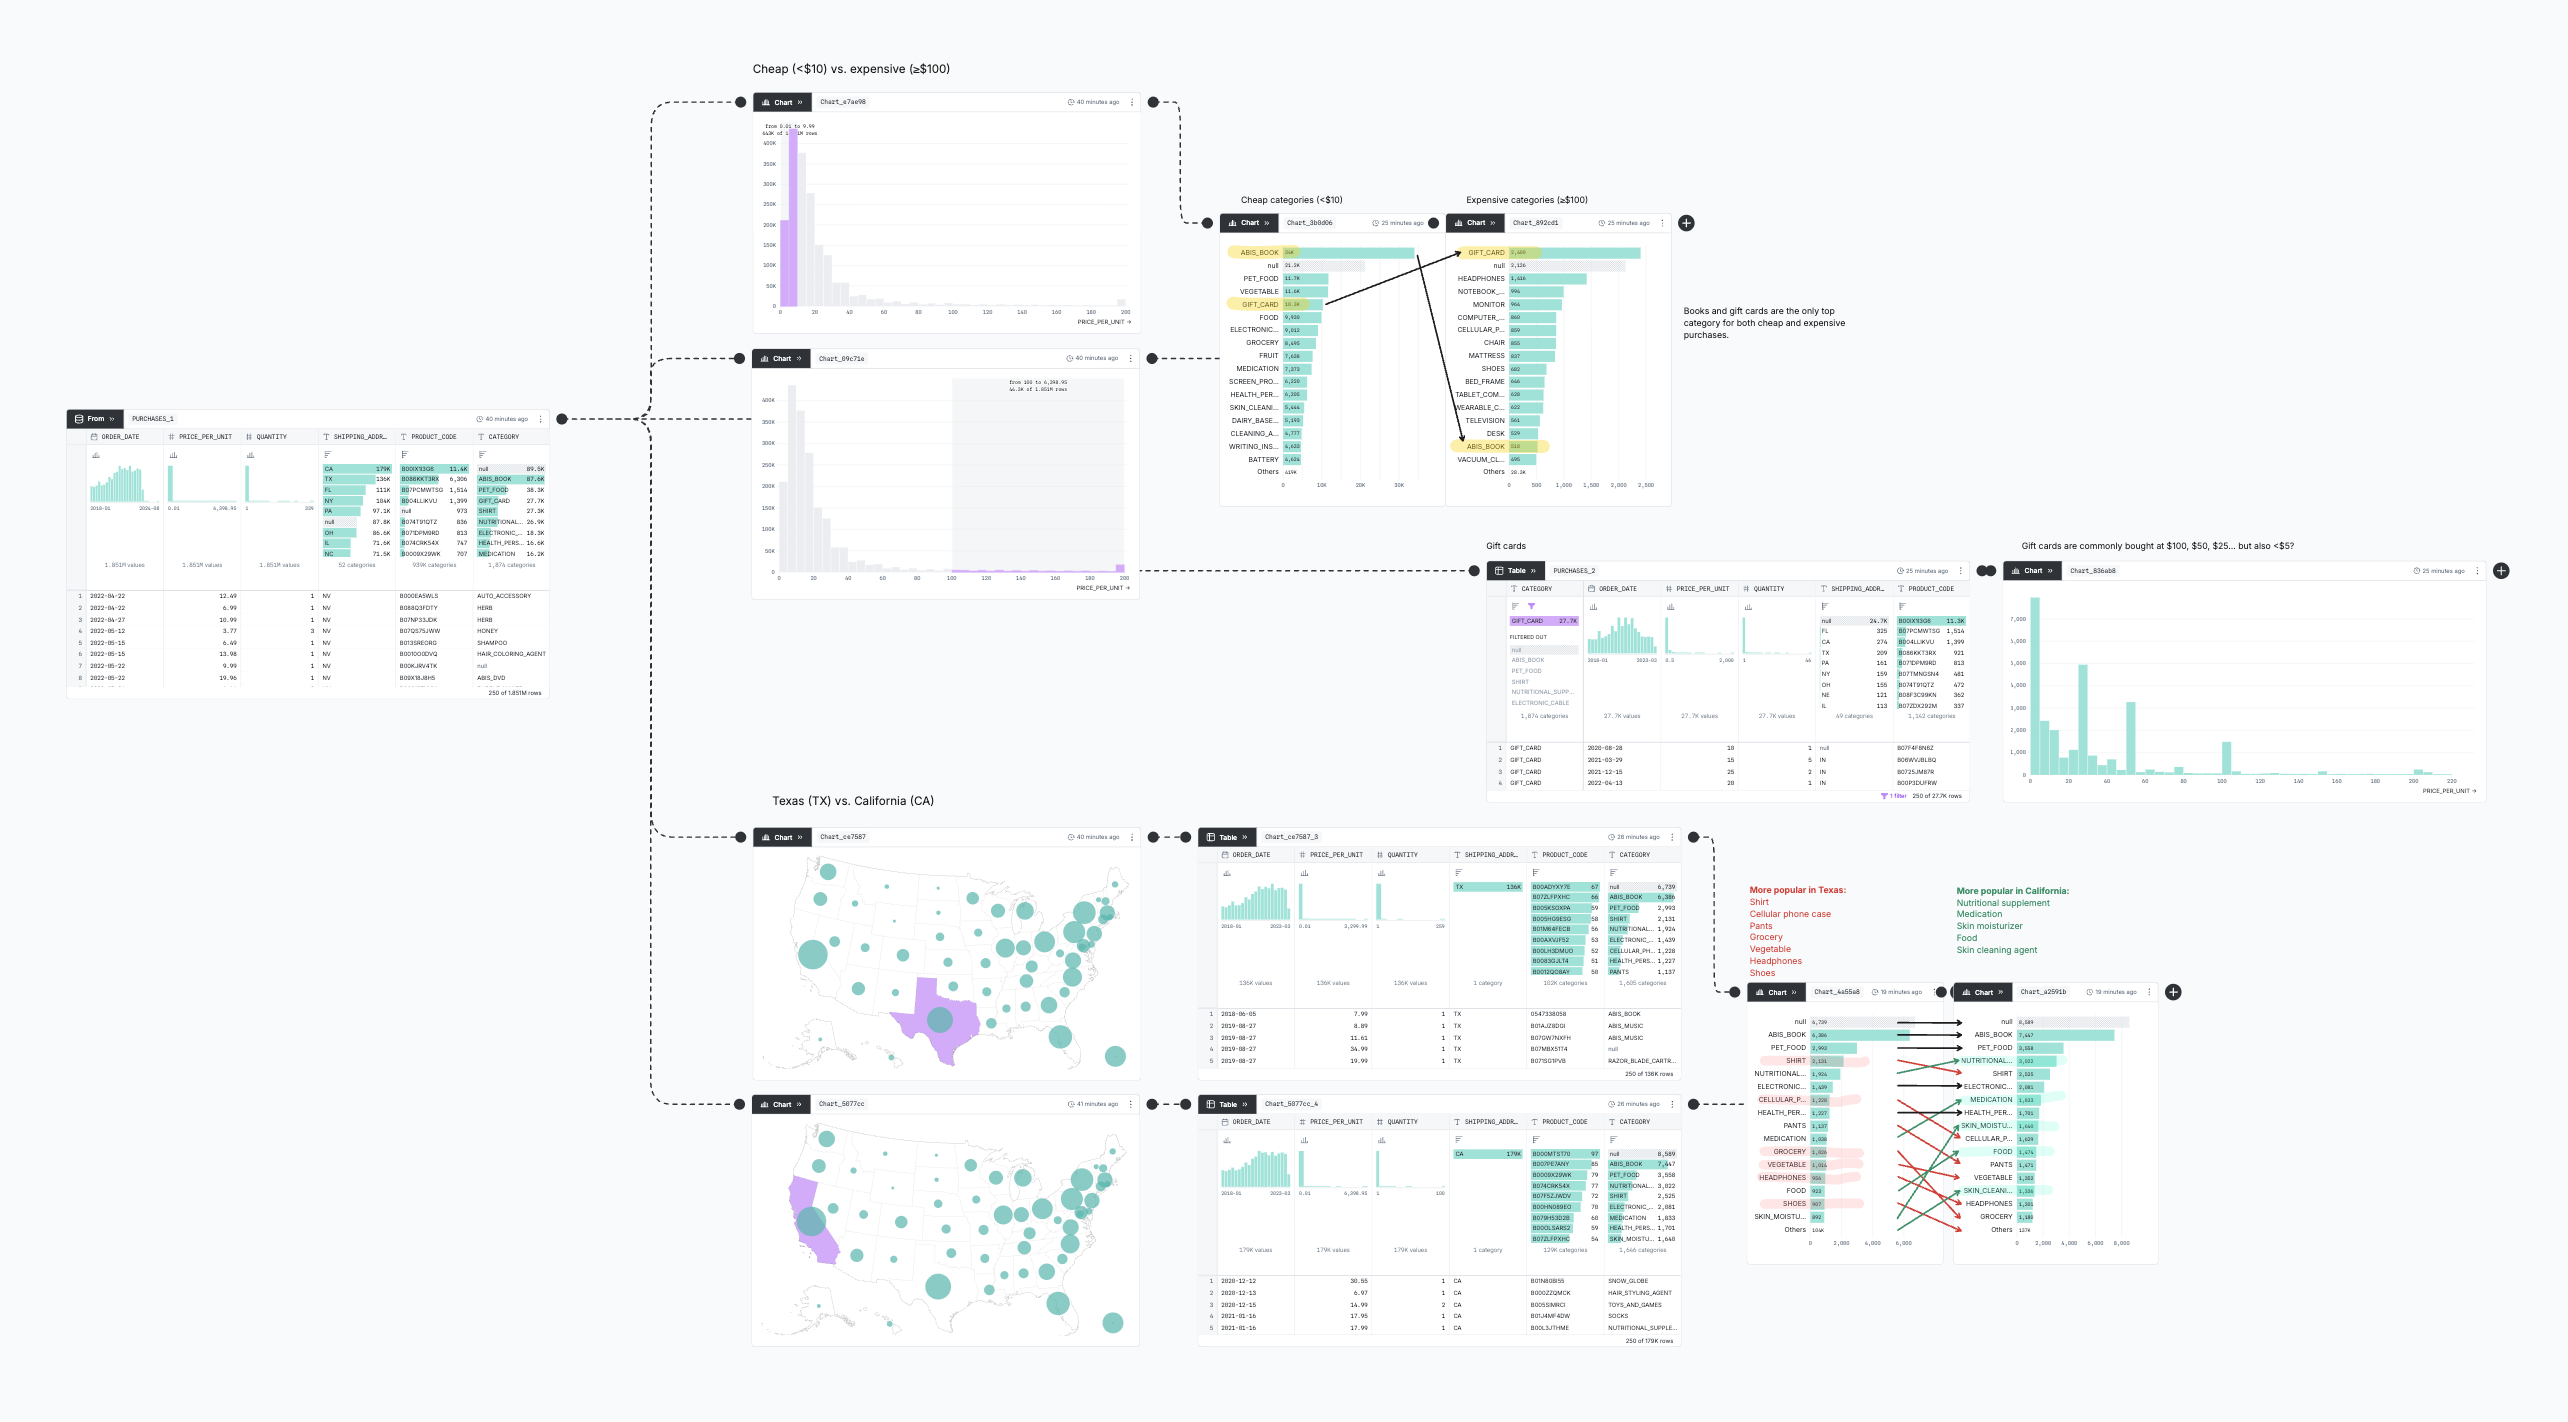
Canvases let you arrange data analysis spatially. Nodes on the canvas represent data tables with rows and columns. From any node, you can derive downstream nodes representing transformed views of the (upstream) node’s data table. For example, starting from a base table in your data warehouse, you can add a downstream node to group rows by a given column, or to join with another table.
Collectively, nodes form a directed acyclic graph (DAG) representing a branching sequence of data table transformations and charts. Like Observable Notebooks, canvases use reactive dataflow: when you edit a node, downstream nodes refresh automatically. You can use reactivity to build lightweight interactive data apps, inviting exploration.
Canvases use summary tables to help you perceive data throughout analysis. These visual overviews help you interpret insights and notice anomalies in underlying data. To accelerate exploration, canvases also encourage direct manipulation — just click on data in a table or chart to filter, exclude, derive, sort, and the like.
Canvases provide realtime multiplayer editing and version history with live presence, cursor chat, and following. Use canvases to present analysis in a meeting, or share a secure link for asynchronous collaboration. You can also frame any part of a canvas to create a presentation-ready dashboard.
The canvas interface
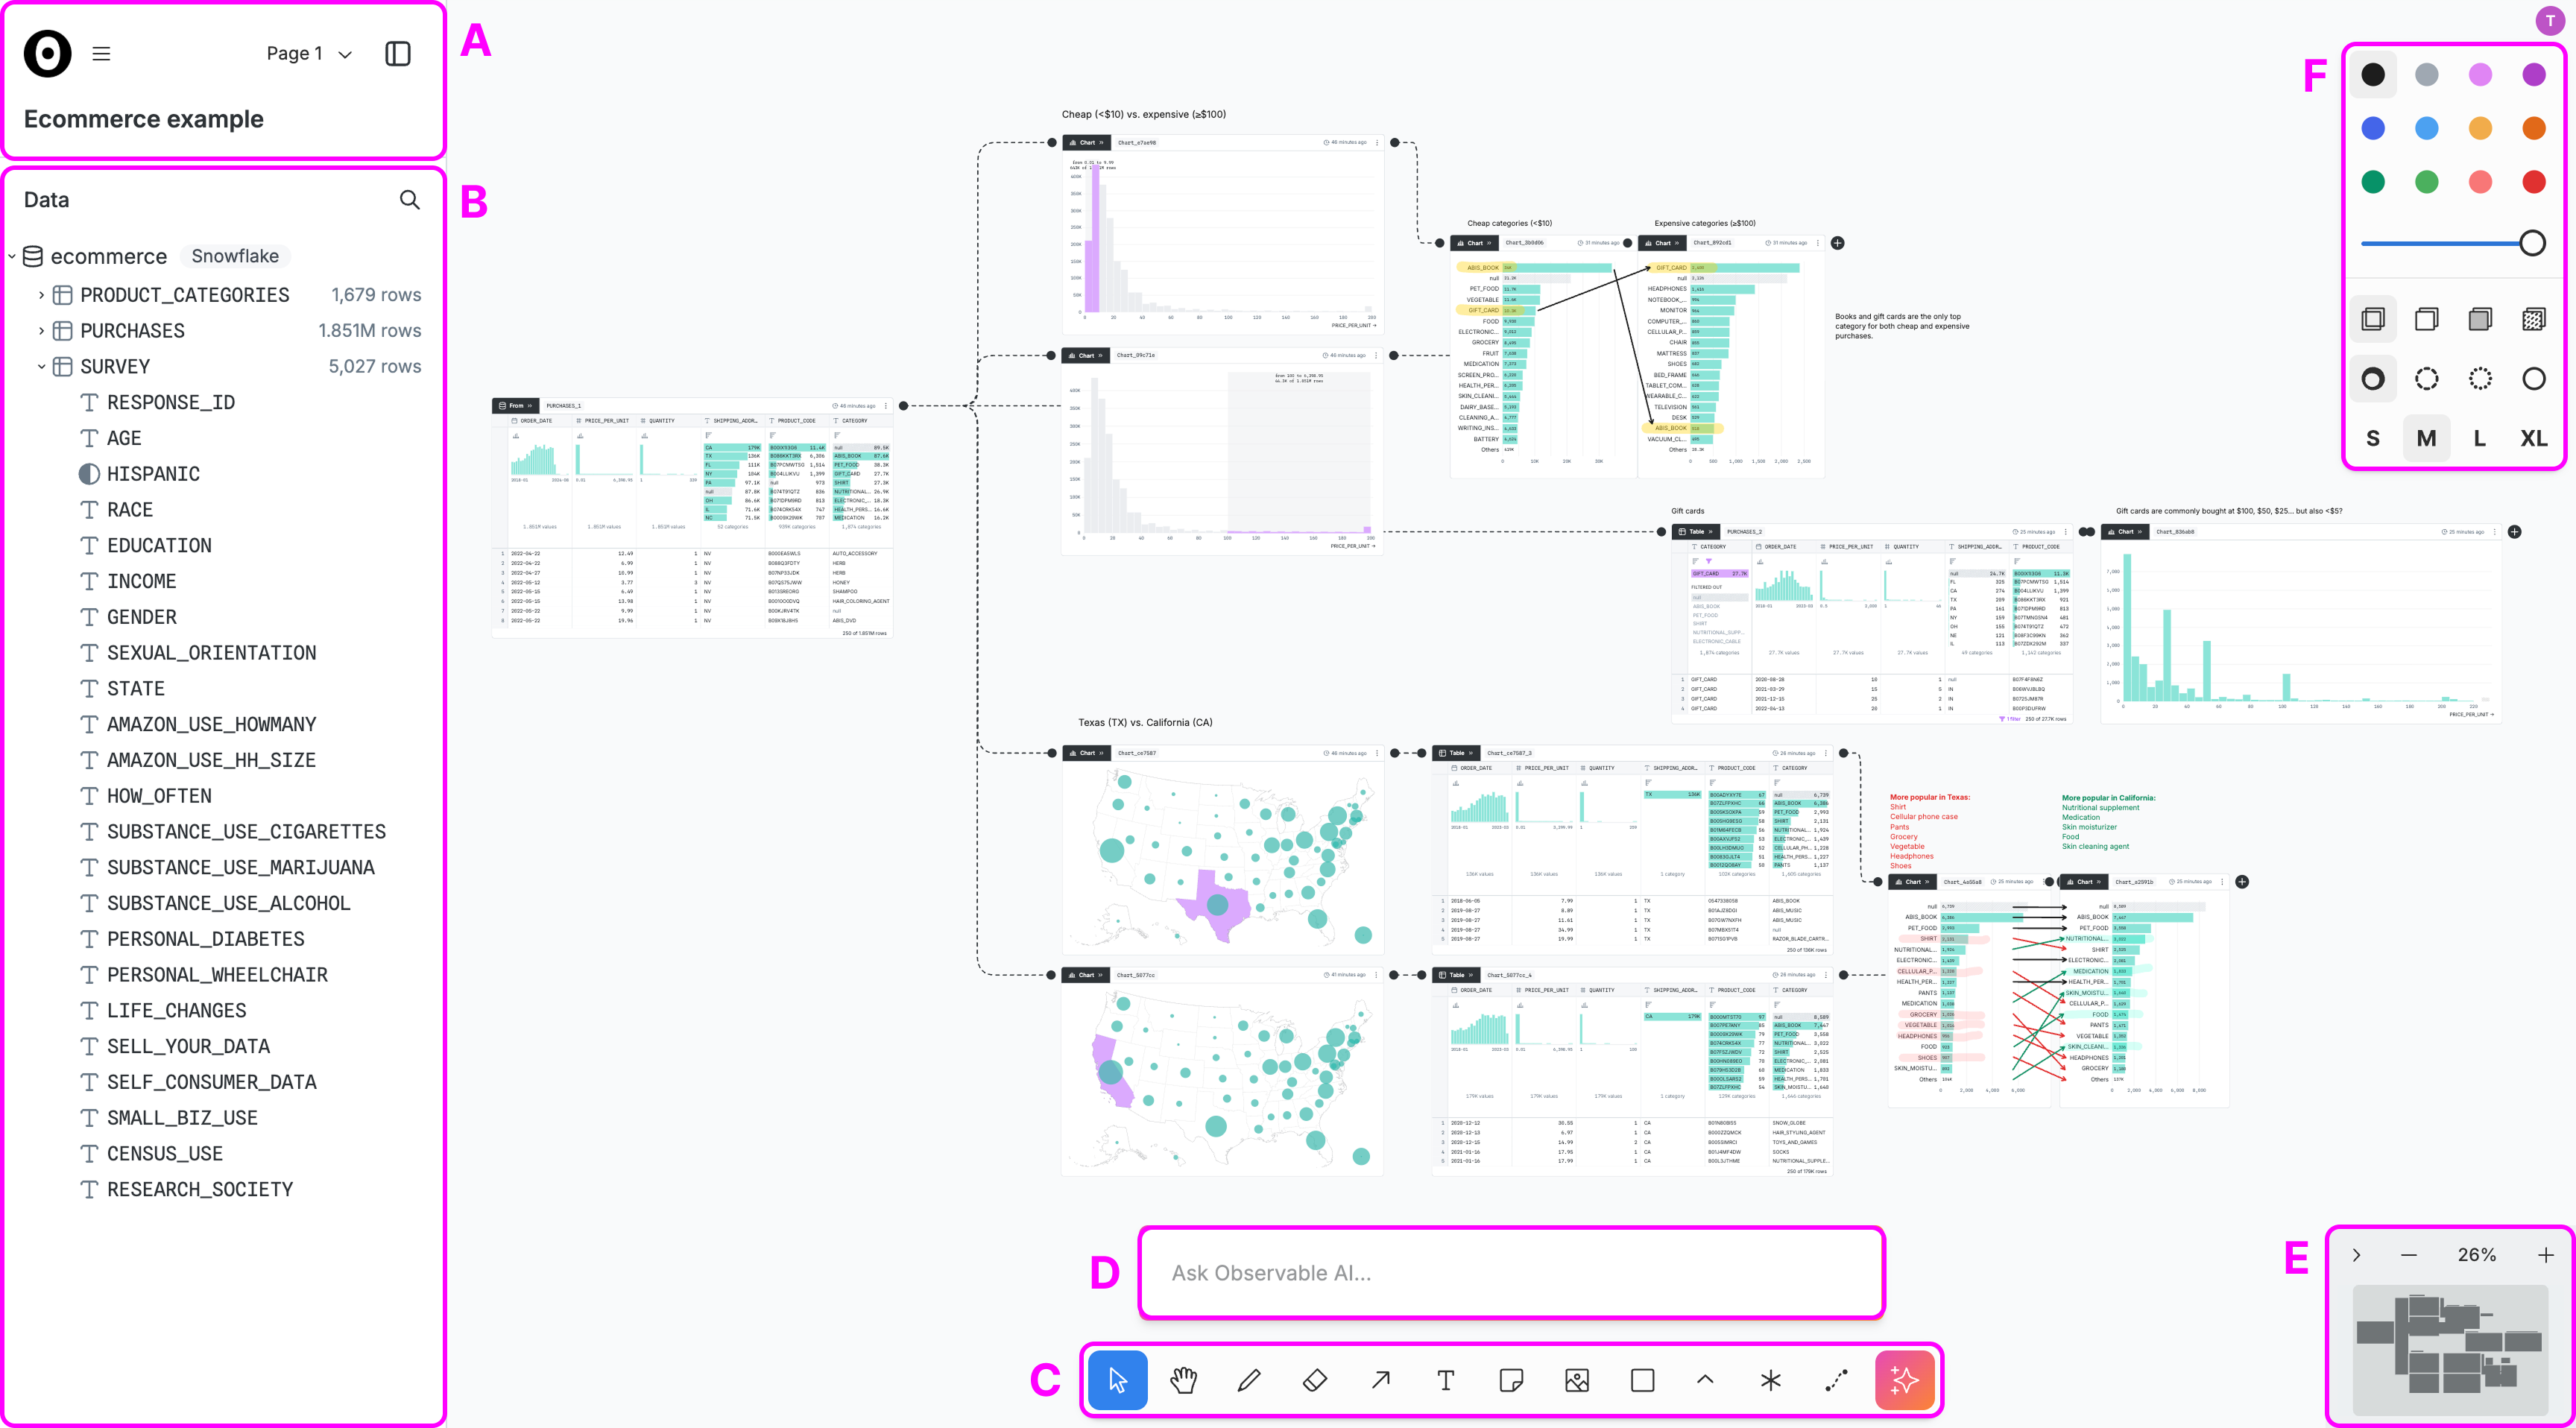
Starting in the top-left and proceeding anticlockwise, the canvas interface provides several overlaying panels for different functions:
You can hide these overlaying panels using Preferences > Focus mode (Command-.) in the main menu. Focus mode is especially useful when presenting analysis.
The title card
The title card contains the main menu (≡), the page menu, the sidebar toggle, and the canvas title.
The main menu
The main menu includes various submenus for performing common actions, such as Undo and Redo. Each action shows the corresponding keyboard shortcut; you can also use the Keyboard shortcuts action to see all available shortcuts. To recover past work, you can Show version history, or add a note to the current state with Save version to history. The main menu includes your Preferences, allowing you to adjust the behavior of the canvas, such as enabling Always snap and Show grid.
The page menu
The page menu allows you to switch between the canvases pages. Each page is effectively a distinct canvas, letting you keep related canvases together under the same URL. For example, you can create a new “scratch” page to keep exploratory work separate from your main analysis. All pages on a given canvas share the same data source.
A canvas initially has a single page named Page 1. Click the plus icon + to add a new page. Rename pages by clicking the edit icon ✎ or by double-clicking the page name. Click the checkmark ✓ to commit your changes. You can also duplicate or delete pages from the page menu ⋮, or reorder pages using the drag handle ⠿ while in edit mode.
To move nodes between pages, right-click on a node or selection, then choose Move to page from the context menu. You can also copy-paste nodes between pages.
The sidebar toggle
The sidebar toggle switches between docked mode (shown above) and minimized mode. When the sidebar is minimized, you can only see the workspace logo, the main menu, the canvas title, and the sidebar toggle. The sidebar is also minimized if you enter focus mode.
The canvas title
The canvas title is the primary identifier for your canvas. E.g., viewers of presentation links will see the canvas title linking back to the full canvas. The title does not have to be unique, though we do suggest you make it unique. Click the title to edit it.
The data panel
The data panel shows the selected data source, which determines where queries represented by nodes will run. The data source contains any number of tables; each table can be expanded to show its columns and their types. Click the “+” beside a table name to add a From node to the canvas. Click the magnifying glass to filter tables by name.
NOTE
A canvas can currently only have one data source, and the data source cannot be changed after the canvas is created. However, you can create a new canvas with a different data source, and then copy-paste nodes to the new canvas.
The minimap
The minimap shows the current zoom level (e.g., 100%) and provides a menu for zooming in and out; on wider windows, and when expanded », the minimap provides a small overview of the canvas while highlighting the current viewport. You can click and drag on the minimap to instantly recenter the viewport on a given position.
The toolbar
The floating toolbar anchored to the bottom of the window shows the currently active tool, and allows you to choose a different tool. By default, the Select (V) tool is active, allowing you to select, move, and interact with nodes. The Hand (H) tool instead interacts with the canvas itself to pan around.
The left side of the toolbar shows whiteboarding tools for drawing text and shapes. The right side shows:
- Add a SQL node - add a blank SQL node in an empty spot on the canvas
- Add a connector - draw connectors between nodes
- Toggle AI - open or close the AI toolbar
The AI toolbar
The AI toolbar is hidden by default; to show it, click the AI icon ✨ on the right of the main toolbar. You can then ask the AI to explain or investigate something about your data or the canvas.
WARNING
Observable collects AI conversations to evaluate and improve user experience. Any messages with AI may be reviewed by Observable staff.
The style panel
The style panel controls the appearance of shapes, including fill and stroke color, opacity, line weight, font style, and more. The active styles in the style panel apply both to selected shapes, and to any new shapes that you add via the Shape tool.
Navigating and editing
Using a trackpad, a two-finger (scroll) gesture will pan the canvas in the given direction horizontally or vertically. Using the Control or Command modifier key, or using two-finger pinch gestures, you can instead zoom in or out.
Using a mouse, you can use the Hand tool (H) to pan the canvas by clicking and dragging; the Space keyboard shortcut will temporarily activate the Hand tool. The mousewheel will pan vertically, or horizontally when using the Shift modifier key. Use the Control or Command modifier key to zoom in or out using the mousewheel.
As you navigate, the canvas URL updates to capture your current viewport. To show someone else the same part of the canvas you’re currently looking at, you can send them your current URL.
TIP
The keyboard shortcuts for Zoom to 100% (Shift-0), Zoom to fit (Shift-1), and Zoom to selection (Shift-2) are useful for rapid navigation.
Click a node to select it. Click an empty spot on the canvas and drag to select multiple nodes. Command-click to add or remove from the current selection. To deselect any selected nodes, click on an empty space in the canvas.
Double-click a node to enter edit mode. In edit mode, you can scroll the results table, filter via column summaries, or change the node’s configuration. Only one node can be in edit mode at a time. To exit edit mode, click on an empty space on the canvas.
For more about multiplayer editing, see collaboration.
For more about sharing your work beyond the canvas, see sharing.
For more about annotating and organizing your shapes, see whiteboarding.